Note: This article discusses Feeds. If you don't have access to Feeds and would like to learn more please contact your Customer Success Manager or Support.
The Multichannel dashboards allow you to view the results and performance of all your communications (Emails, Feeds Posts, Articles, etc...) across multiple channels. All Multichannel dashboards are available at Enterprise and Sub-account level, and metrics are aggregated in Enterprise level dashboards (e.g. if 5 sub-accounts have feeds enabled, the enterprise level dashboard will show combined totals for all five accounts)
There are 4 Multichannel dashboards:
This article provides information on how to find your reports, how to filter them, and a break down of the various report tiles within the Multichannel Content Performance dashboard.
The Multichannel Content Performance dashboard provides a view of engagement on individual pieces of content published across Email, Mobile, SharePoint and Teams. This dashboard can help answer the question of which pieces of content received the most engagement and on what channel did the content receive most engagement, helping you to easily identify successful trends and problem areas.
Note: Within your Poppulo account, you can hover over the info markers on each report tile for further information as needed.
Watch this overview on Content Performance and then read more below.
-
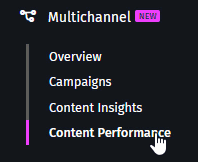
In the Reports area of your account, select Content Performance from the Multichannel menu on the left.
-
These reports can be filtered by Content Sent Date and Date Granularity, by choosing options in the Content Sent Date and View By drop-downs and selecting the Update button (As shown below).
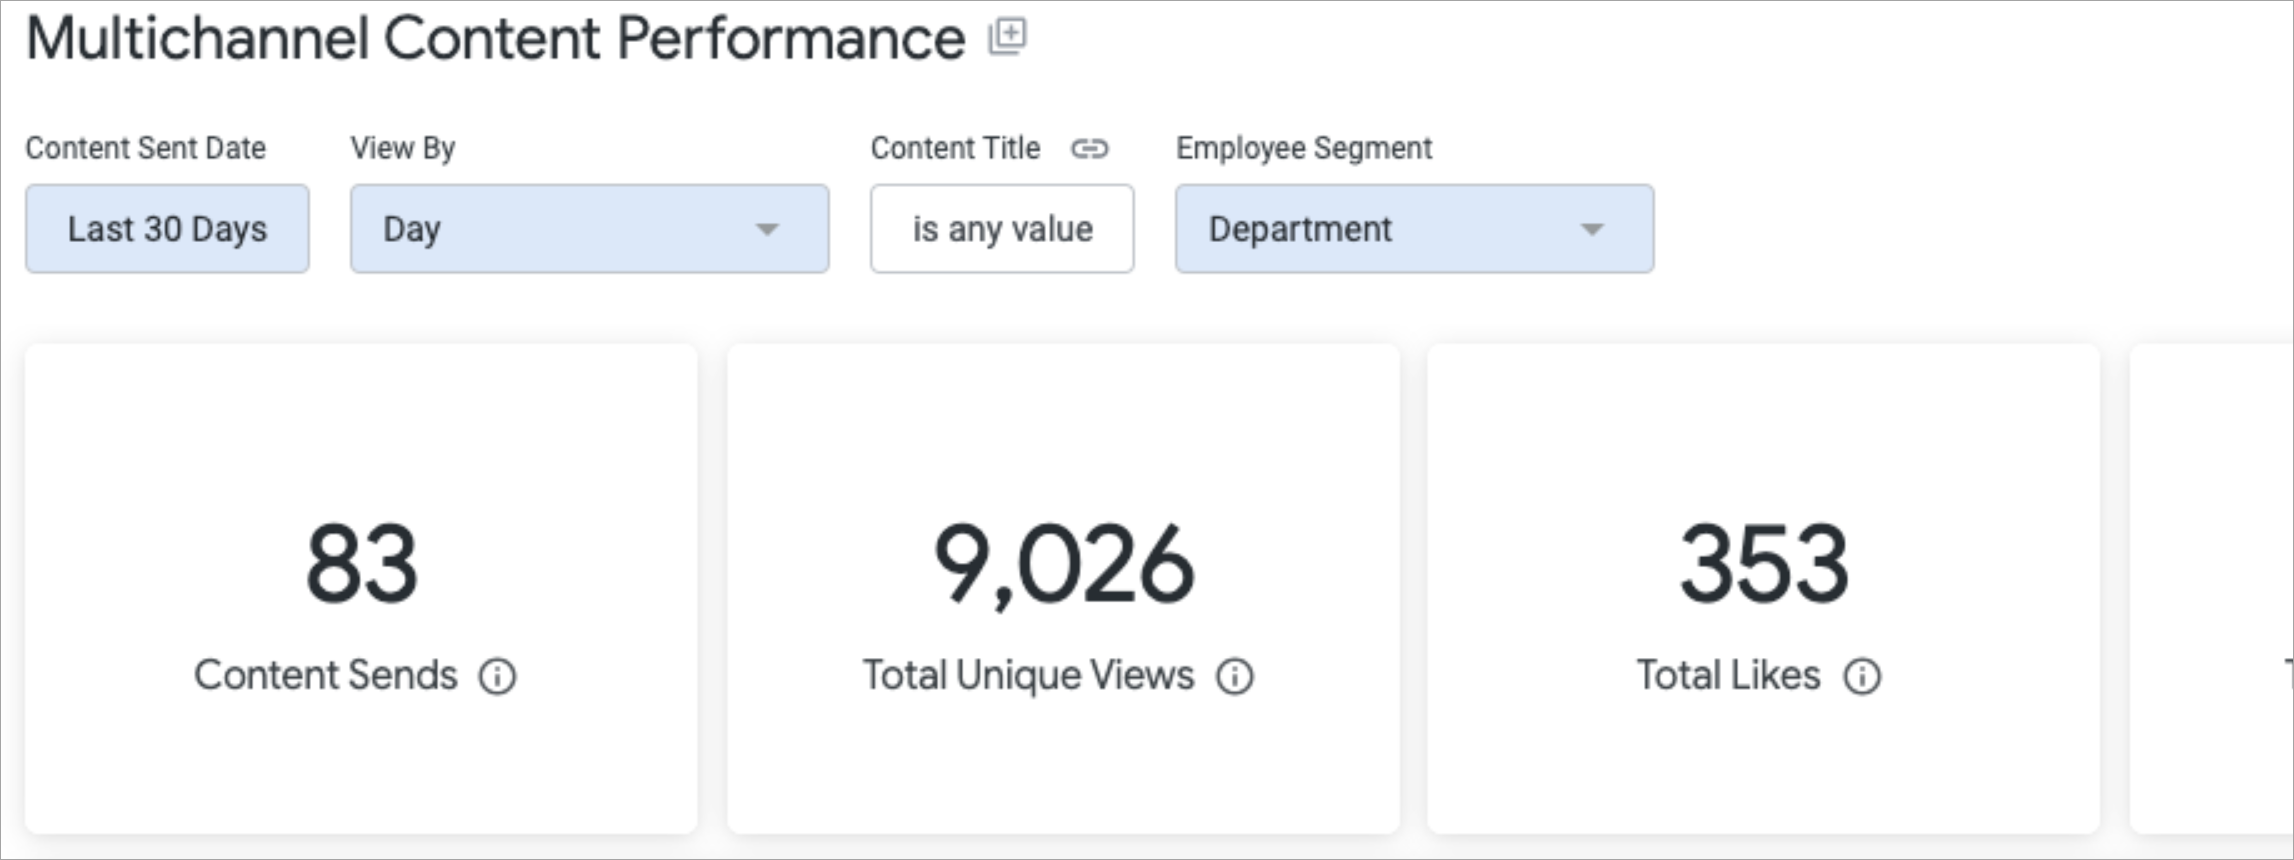
You can choose to filter your results by a specific piece of content, by selecting the Content Title option. You can choose a recent post from the drop-down, or search by typing in the any value box.
The results can also be filtered by Employee Segment. By default, the table is segmented by Department.
Note: All calculations will be based on the filters a user has selected, unless otherwise stated.
- Whenever you make changes to your filter, remember to select the Update button, at the top right of the screen, to view the updated results.

The following section is a break down of each report tile in the
Multichannel Content Performance dashboard.
Note: You can also Download Reports, from any of your report tiles, by hovering over the tile, selecting the Tile Actions (the 3-dot icon), and choosing Download data. 
Keep in mind that each report is based on your selected Date Ranges, Content Title and Employee Segments.
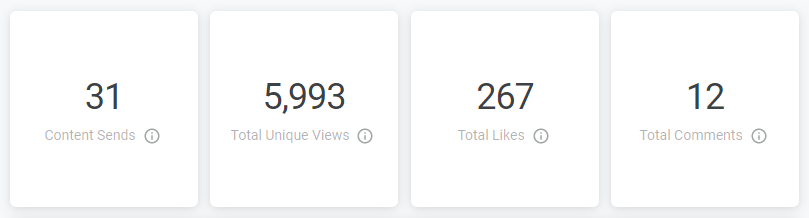 Content Sends
The total amount of Emails and Posts that were sent in the selected date range.
Note: Email resends and test sends are not counted in the total sends.
Total Unique ViewsThe total amount of unique Multichannel content views.
Total LikesThe total amount of likes on your Multichannel content.
Total CommentsThe total amount of comments on your Multichannel content.
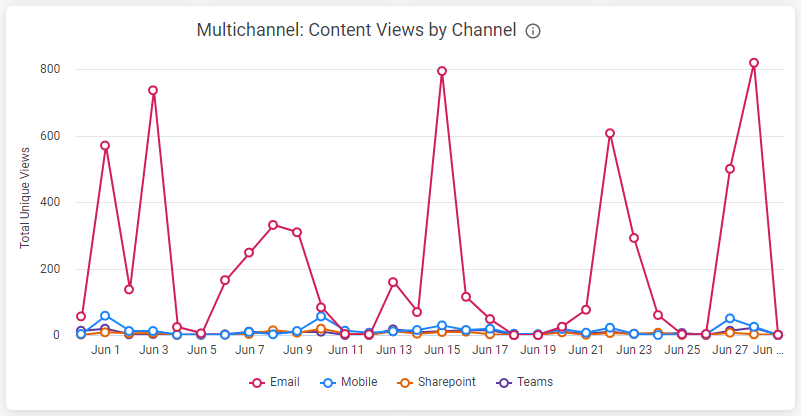
Multichannel: Content Views by ChannelThe unique Multichannel content views, split by channel and displayed over your chosen date range.
 Multichannel: Most Viewed Email Content
This chart shows your Email content with the highest unique views. This includes Newsletters, Flyers and Articles.
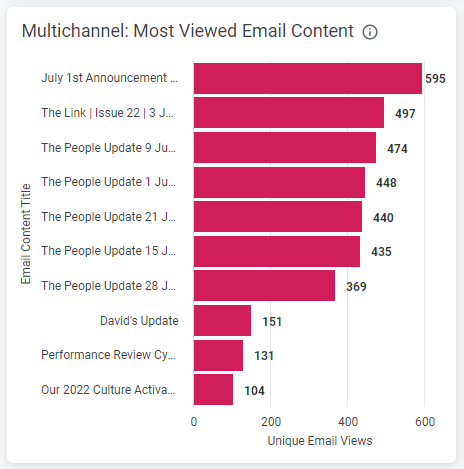 Note: Repeat views of the same piece of content, by the same person, are not counted. Multichannel: Most Viewed Posts
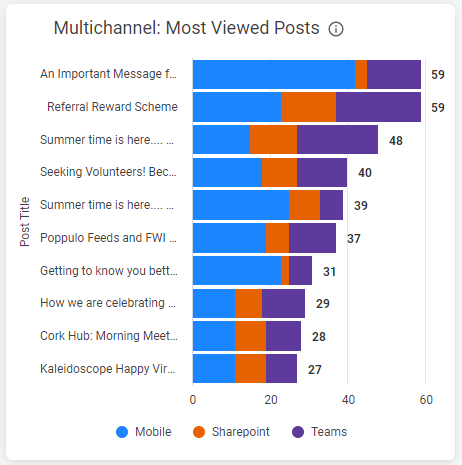
This chart shows your Multichannel Posts with the highest unique view count. The ranking is based on the sum of the total unique views on each channel.
 Note: Repeat views of the same piece of content, by the same person, on the same channel are not counted. Multichannel: Unique Views by Channel Trend
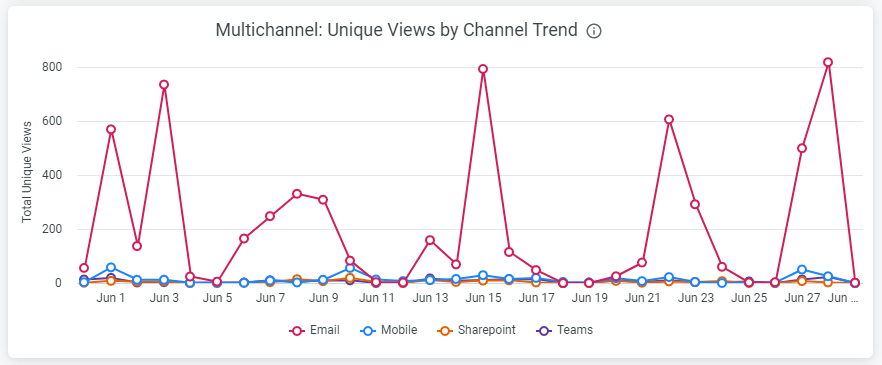
This trend shows unique Multichannel content views, split by channel, displayed to show performance over time.
 Multichannel: Performance of Content Sent
 This table shows the performance of Multichannel content that was sent within your selected date range and provides a break down of Content by Title, Type (Post, Flyer, Newsletter, Article), Reach, Views across Channels (Email, Mobile, SharePoint and Teams), Likes and Comments. The table is sorted by Content Send Date by default. Scroll across the table to see more columns, and hover over the column headings to reveal further sorting options.
 Note: The breakdown can changed by Employee Segment selected in the filter at the top of the dashboard. Multichannel: Performance by Employee Segment
This table shows the performance of different employee segments by Reach, Views across channels, Likes and Comments. Scroll across the table to see more columns, and hover over the column headings to reveal further sorting options.
 Note: Remember, the breakdown can changed by Employee Segment selected in the filter at the top of the dashboard.
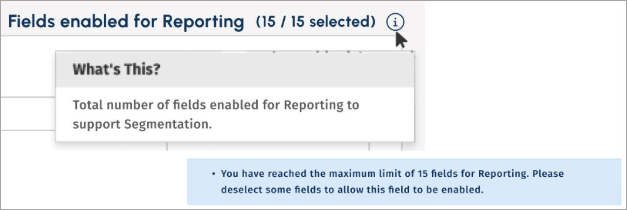
For improved reporting, you may select up to 15 fields.
