The Email Campaigns dashboard tracks the performance of any Campaigns you have created. This dashboard will help you to measure how your workforce is responding to important business initiatives, it allows you to quickly inspect results to understand which Campaigns are having the most impact, and can help provide insight into where organizational efforts are best focused or where the approach needs amending.
This article provides information on how to find this report, how to filter it, and a break down of the various report tiles within the Email Campaigns dashboard.
If you have Feeds or Mobile, you will find a dashboard for Advanced Multichannel Reports: Campaigns. If you do not have Advanced reports, you can View a Campaign Activity Report.
Note: It can take up to 24 hours after an Email send for data to process and display in this report.
Note: Within your Poppulo Harmony account, you can hover over the info markers on each report tile for further information as needed.
This report is available as an Enterprise and Sub-Account report. At Sub-Account level, data is only related to the Account that you viewing the report in. The Enterprise report will display aggregated data for all sending Accounts within your Enterprise.
-
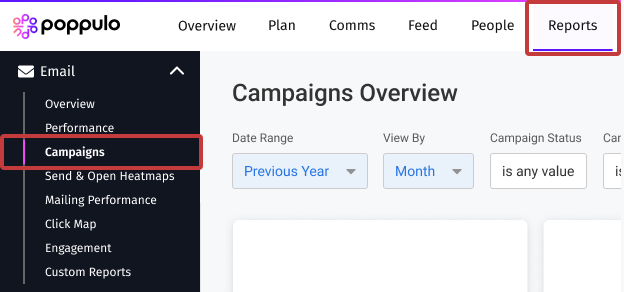
In the Reports Area of your Account, select Campaigns from the Email reports menu on the left.
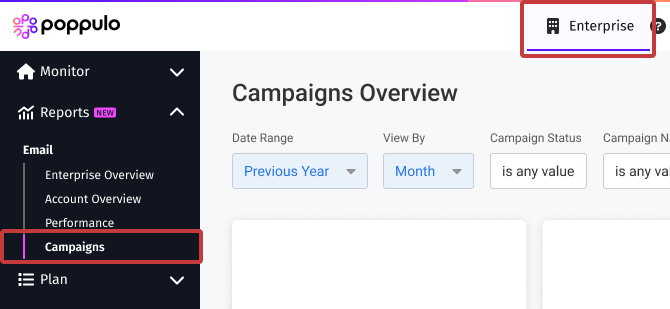
At the Enterprise level, you can find the report by selecting Reports from the menu on the left and choosing Campaigns from the expanded Email reports menu.
-
This report can be filtered by Date Range and Date Granularity, by choosing options in the Date Range and View By drop-downs and selecting the Update button (As shown below).
You can choose to filter your results by Campaign Status (Active or Closed), and by one or more specific Campaigns by selecting the Campaign Name drop-down.
The results can also be filtered by Employee Segment (By default the table is segmented by Department, but there are more filters to choose from the drop-down).
And you can select from More options to filter/cross-filter metrics based on your own Employee data in Poppulo.
Note: All calculations will be based on the filters a user has selected, unless otherwise stated.
- Whenever you make changes to your filter, remember to select the Update button, at the top right of the screen, to view the updated results.
The following section is a break down of each report tile in the
Email Campaigns dashboard.
Note: You can also Download Reports, from any of your report tiles, by hovering over the tile, selecting the Tile Actions (the 3-dot icon), and choosing Download data. 
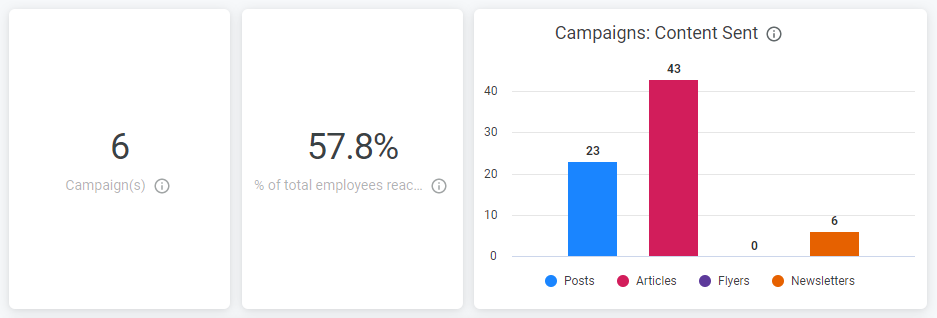 Campaign(s)
The unique count of Campaigns, where there has been any engagement with any Campaign content during the selected date range.
% of total employees reachedThe percentage of employees who opened or viewed at least one piece of content associated with a Campaign. This is based on all People in your organisation.
Campaigns: Content SentThis chart shows the break down by content type (Feeds Post, Articles, Flyers, Newsletters) for any content associated with a Campaign.
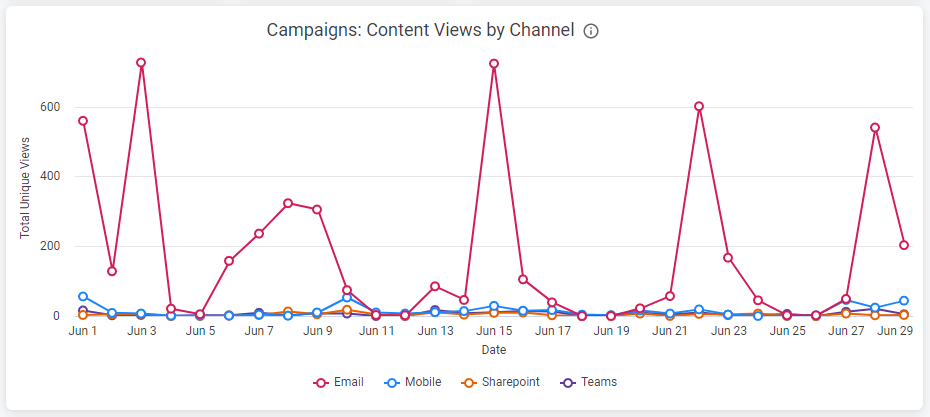
Campaigns: Content Views by ChannelA trend of unique views of content tagged with a Campaign, split by channel (Email, Mobile, SharePoint, Teams) and displayed over your chosen date range.
 Campaigns: Performance by Employee Segment
This table shows the performance of different employee segments for any content associated with Campaign, sorted by Reach, Views across channels, Likes and Comments. Scroll across the table to see more columns, and hover over the column headings to reveal further sorting options.
 Note: Remember, the breakdown can changed by Employee Segment selected in the filter at the top of the dashboard.
  Campaigns: Performance of Content Sent
 This table shows the performance of individual pieces of content that were tagged with a Campaign before publishing. It provides insight on the Content Type that has been tagged (Post, Flyer, Newsletter, Article), The Campaign Name, Reach, Total Unique Views, Likes and Comments. The table is sorted by Content Send Date by default. Scroll across the table to see more columns, and hover over the column headings to reveal further sorting options.
 Related Articles:
