When you Create a Custom Report, there are several report types to choose from. Each different report type will help you target the specific data which suits your organisational needs.
The Trending Report across Multiple Emails shows selected metrics for single or multiple mailings. To create a Trending Report across Multiple Emails, follow the instructions below:
To Create a Trending Report across Multiple Emails:
-
Create a Custom Report
-
On the Custom Reports screen, select the New report button.

-
The Create a new Report page is where you can choose your Report Name, Format and Type.
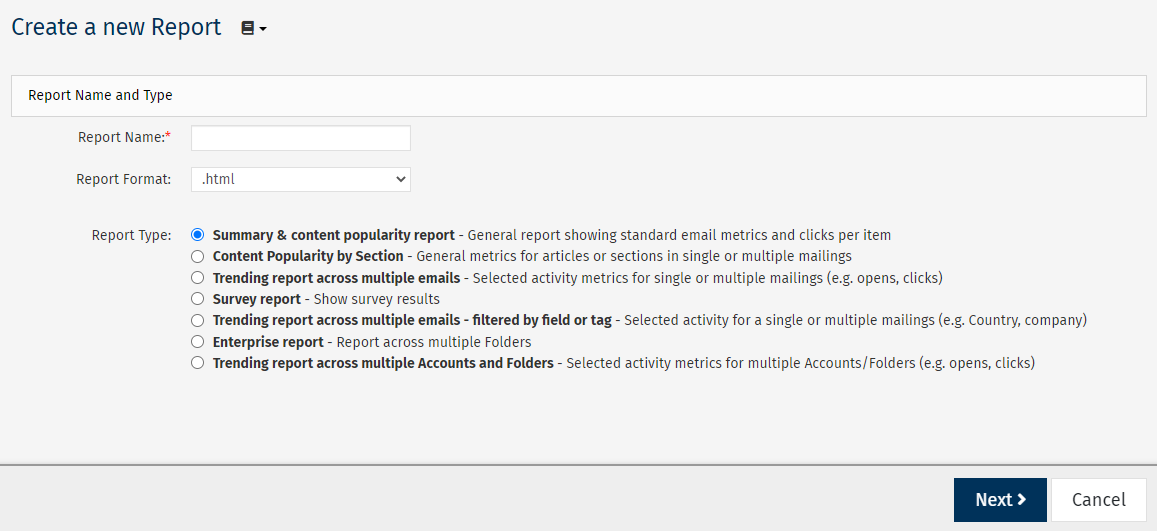
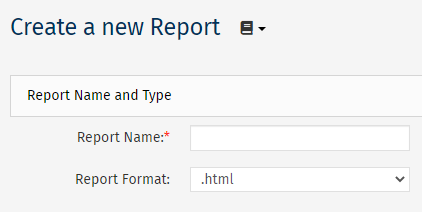
Enter the Report Name and choose your preferred Report Format for viewing the data.
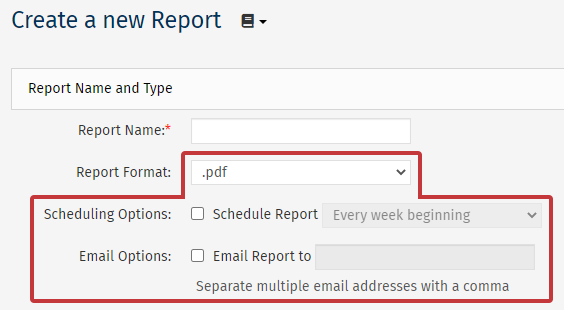
Note: Some report formats have a limit on how many emails you can report on. Limits - PDF(.pdf): 60 emails, Excel(.xls): 200 emails.
Choosing .pdf, .csv or .xls, as the Report Format will reveal additional Scheduling and Email Options (see below).
-
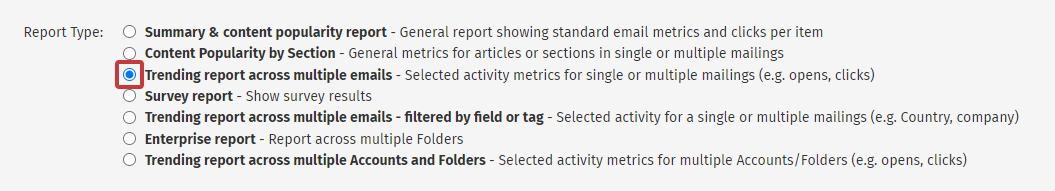
Choose the Trending report across multiple emails radio button under Report Type and click Next.
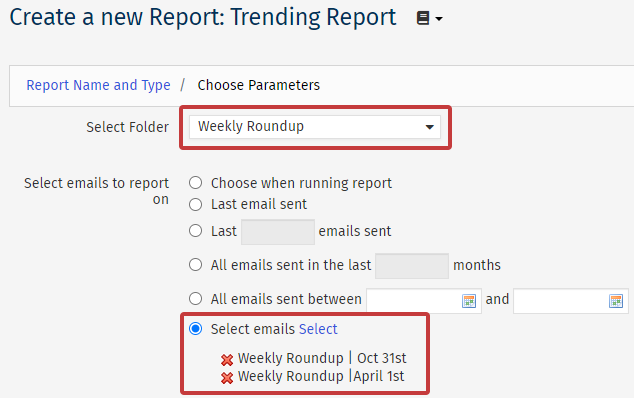
- Choose Parameters.
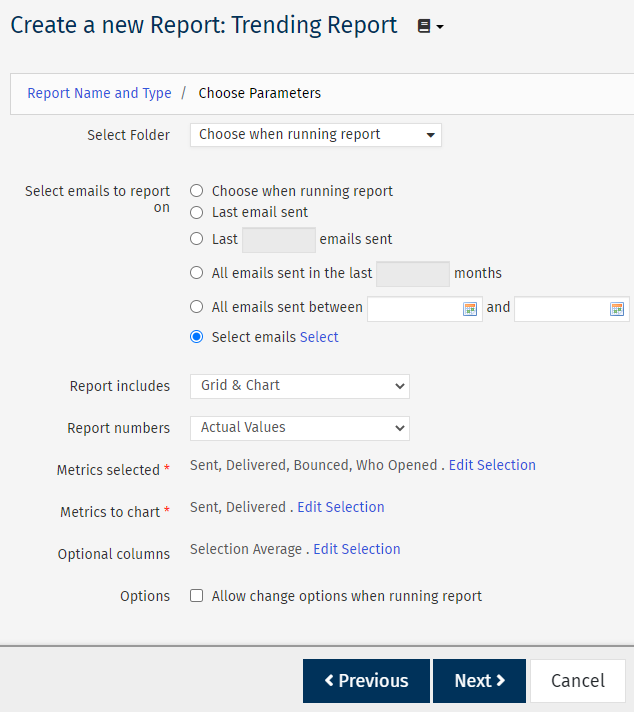
Use the Select Folder drop-down to choose your email Folder, and choose from the Select emails to report on radio buttons. These are the emails that your report will be based on.
Note: When selecting a Folder, you can select the option Choose when running report, however, this option is not available if you have scheduled the report in Step 3. Additionally, If you set the Folder to Choose when running the report, you will not be able to choose the Select emails option as above in step 5. This is because the Folder first needs to be defined. You'll be able to choose the emails to report on when you select the Folder when running the report.
-
Complete the additional parameter options. Then, choose Next.
-
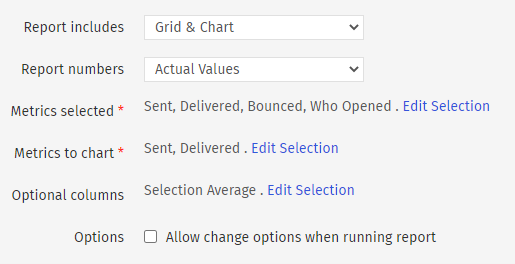
Report includes - Choose whether your data is displayed in a Grid, Chart or both in your report.
-
Report numbers - Choose whether your figures are displayed as Actual Values, Percentages or both in your report.
-
Metrics Selected - Choose the metrics to appear in the grid.
Note: Sent, Delivered, Bounced and Who Opened will be selected by default.
-
Metrics to chart - Choose the metrics that will appear in the chart.
Note: Sent and Delivered will be selected by default.
-
Optional columns - Choose if you'd like to include in your report the additional columns of the selection average and/or distinct figure.
- Options - This allows you to make changes when running the report.
-
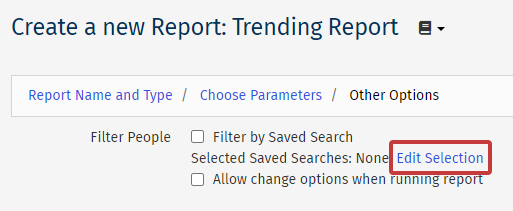
Choose to filter by Saved Search(or not) and click Next.
-
Filter by Saved Search - This allows you to run your report on a specific group of employees, excluding those not in your selected saved search. Use the checkbox to enable the filter and then and click Edit Selection to choose a Saved Search.
Checking Allow change when running the report checkbox will enable you to choose (or choose to overwrite) your filters when running your report.
- Review your Trending report across multiple emails and then click Save. (Alternatively, click Save & Run to run the report now.)
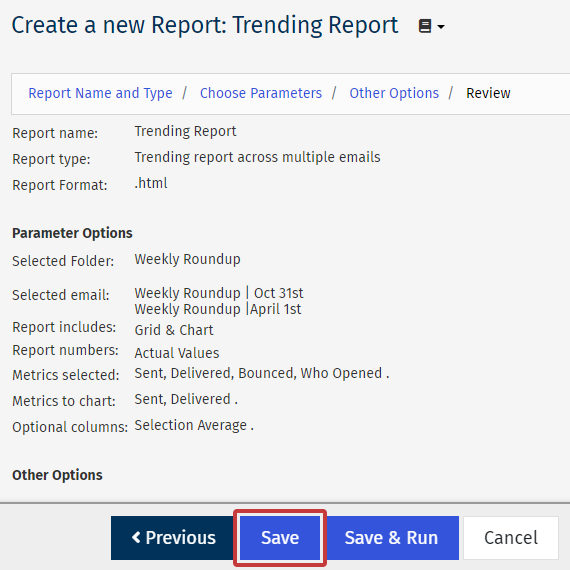
Note: The Review page is a complete summary of all information entered during the Create a Report Wizard. Review this information carefully to ensure your report accurately targets the data you would like to capture.
