Note: This article discusses Feeds. If you don't have access to Feeds and would like to learn more please contact your Customer Success Manager or Support.
The Multichannel dashboards allow you to view the results and performance of all your communications (Emails, Feeds Posts, Articles, etc.) across multiple channels. All Multichannel dashboards are available at Enterprise and Sub-account level, and metrics are aggregated in Enterprise level dashboards (e.g. if 5 sub-accounts have feeds enabled, the enterprise level dashboard will show combined totals for all 5 accounts)
The four Multichannel dashboards are:
This article provides information on how to find your reports, how to filter them, and a break down of the various report tiles within the Multichannel Overview dashboard.
The Multichannel Overview provides at-a-glance insight on channel performance, the percentage of employees being engaged and which channels are receiving the most engagement, helping you to identify overall performance across channels; which areas are performing strongly and which may need more attention.
Note: Within your Poppulo account, you can hover over the info markers on each report tile for further information as needed.
Watch this video about the Overview dashboard then read more below.
-
In the Reports area of your account, select Overview from the Multichannel menu on the left (if not already selected).

-
These reports can be filtered by Content Sent Date and Date Granularity, by choosing options in the Content Sent Date and View By drop-downs and selecting the Update button.
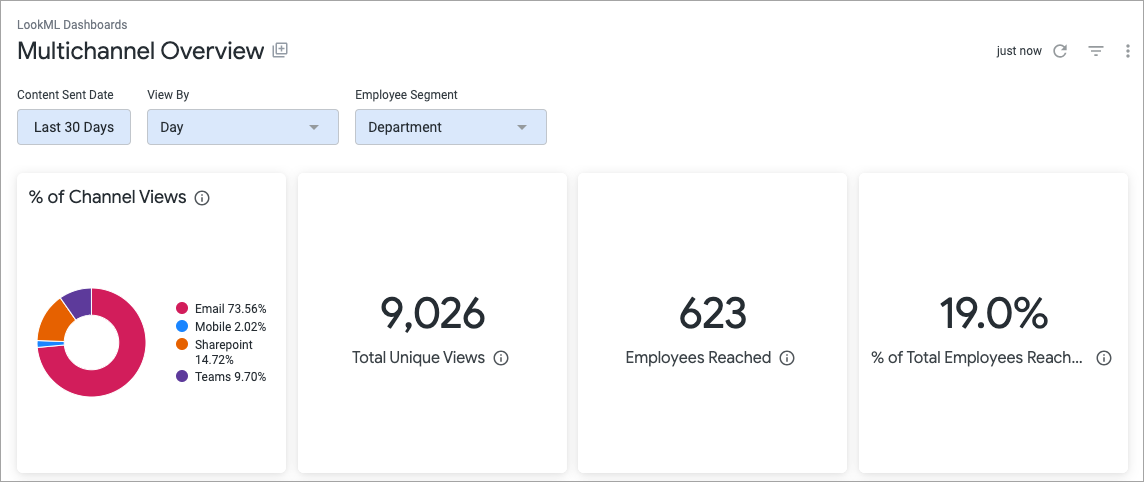
The results can also be filtered by Employee Segment. By default, the table is segmented by Department. Select the drop-down arrow to choose your Campaign.
You can filter by Employee Segment. You can ‘Select Segment’ from the dropdown, which contains 15 pre-defined segments that correspond to your people fields. Updating this filter only impacts the ‘Performance by Employee Segment’ table. Note that any segment values which have less than 10 results will not be exposed in this table.
Note: All calculations will be based on the filters a user has selected, unless otherwise stated.
- Whenever you make changes to your filter, remember to select the Update button, at the top right of the screen, to view the updated results.


For improved reporting, you may select up to 15 fields.
The following section is a break down of each report tile in the Multichannel Overview dashboard. Keep in mind that each report is based on your selected Date Ranges and Employee Segments.
Note: You can also Download Reports, from any of your report tiles, by hovering over the tile, selecting the Tile Actions (the 3-dot icon), and choosing Download data.
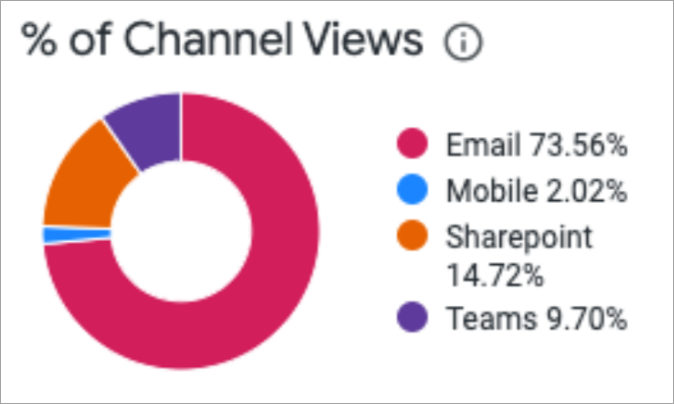
Channel Views Percentage
This pie chart shows the unique Multichannel content views that occurred in the selected date range, split by channel and displayed as a percentage.
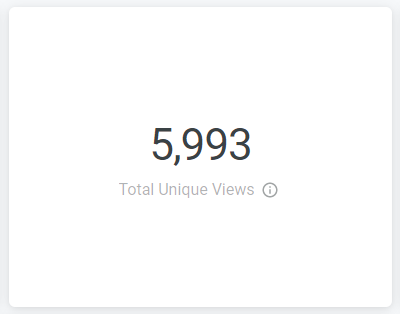
Total Unique Views
The total number of unique Multichannel content views.
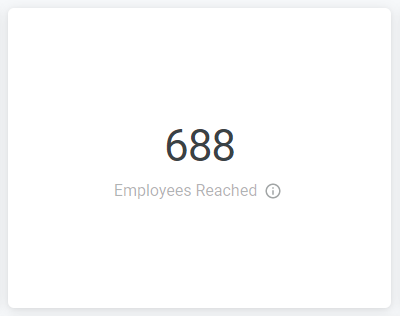
Employees ReachedThe total number of employees who opened or viewed at least one piece of Multichannel content.
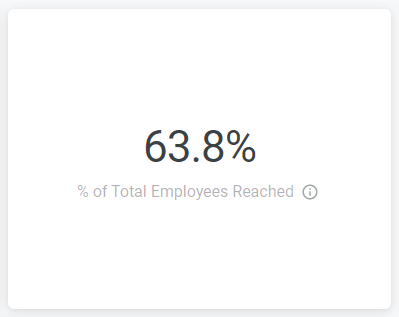
% of Total Employees Reached
The percentage of employees who opened or viewed at least one piece of Multichannel content, based on all employees who were sent the communication.
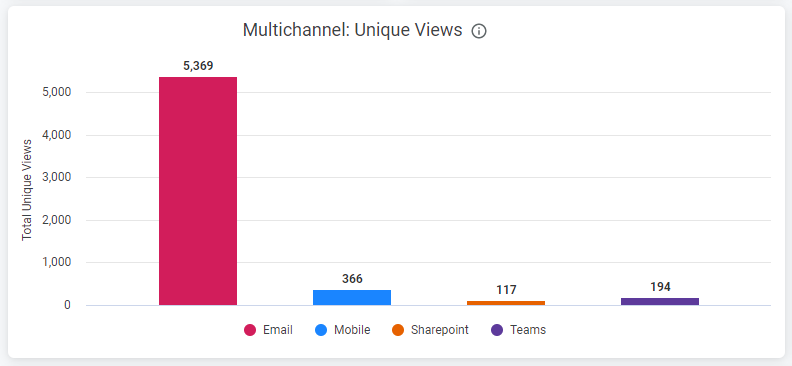
Multichannel: Unique Views
The number of unique Multichannel content views, split by channel.
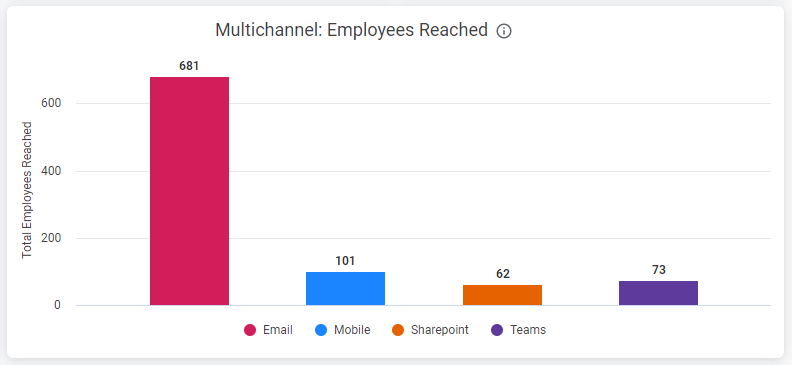
Multichannel: Employees Reached
The number of unique employees who opened or viewed at least one piece of Multichannel content, split by channel.
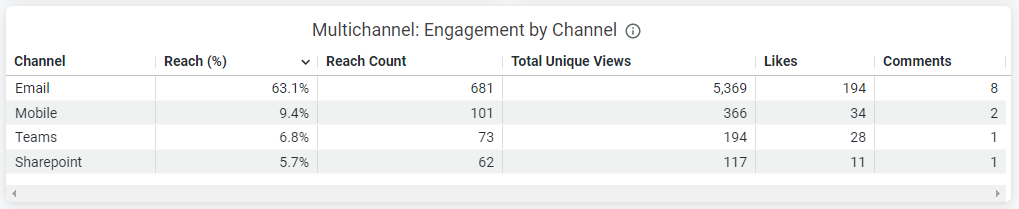
Multichannel: Engagement by Channel
This table shows a breakdown of engagement by channel. By default the table is ordered Reach (%) descending, but you can sort the table by hovering over the column titles to reveal sorting options.
Multichannel: Unique Views by Channel Trend
This trend shows unique Multichannel content views, split by channel, displayed to show performance over time.

Multichannel: Performance by Employee Segment
This table shows the performance of employee segments by Unique Employees Reached, Total Employees, Views across channels (Email, Mobile, SharePoint, MS Teams), Likes and Comments. To view more columns, scroll across the table, and hover over the column headings to reveal sorting options.
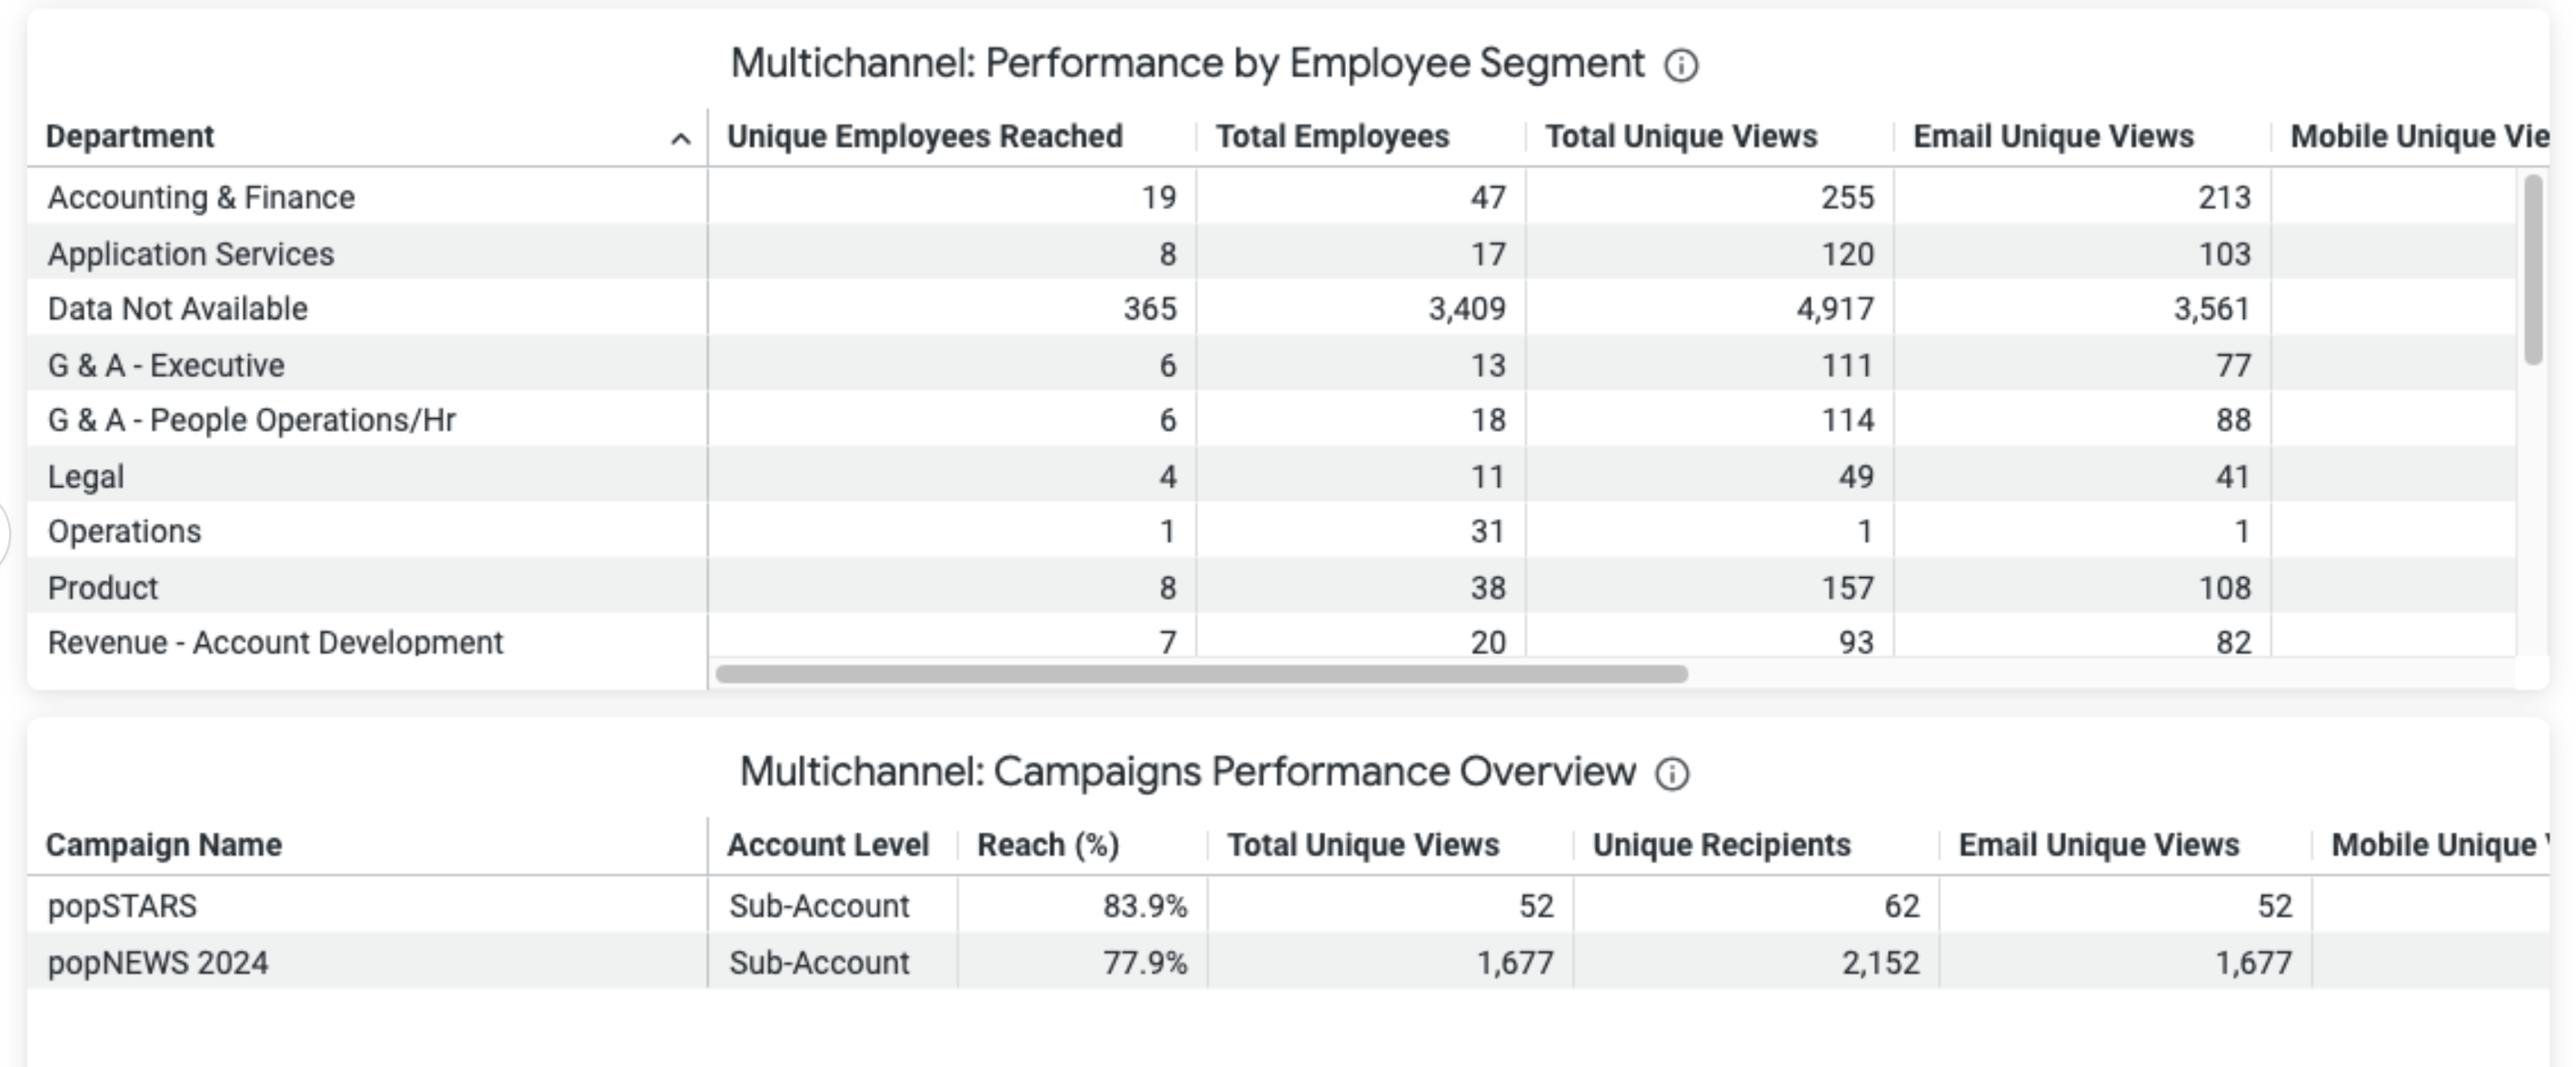
Note: Remember, the breakdown can be changed by Employee Segment at the top of the dashboard.
Multichannel: Campaigns Performance Overview
This table shows a comparative of all active Campaigns within your account. The table indicates whether a campaign has been created at the Sub-Account or Enterprise level and provides different engagement metrics per campaign by Reach (%), Unique views across channels (Email, Mobile, Sharepoint, MS Teams) and Likes and Comments. Hover over the column headings to reveal further options.