Note: This article discusses Feeds. If you don't have access to Feeds and would like to learn more please contact your Customer Success Manager or Support.
The Multichannel dashboards allow you to view the results and performance of all your communications (Emails, Feeds Posts, Articles, etc...) across multiple channels. All Multichannel dashboards are available at Enterprise and Sub-account level, and metrics are aggregated in Enterprise level dashboards (e.g. if 5 sub-accounts have feeds enabled, the enterprise level dashboard will show combined totals for all 5 accounts)
There are 4 Multichannel dashboards:
This article provides information on how to find your reports, how to filter them, and a break down of the various report tiles within the Multichannel Content Insights Themes dashboard.
AI powered Content Insights effortlessly reveals how your organisation is responding to cross-cutting topics that matter. Natural Language Processing (NLP) auto-analyses your Feed post content as you create it, detecting and tagging it with the relevant themes. The Content Insights Themes reporting dashboard helps you understand which of the top 10 most prevalent standard themes are most, and least, commonly represented and engaged with, providing a vital pulse across your organisation of content relevance, resonance and noise.
Note: Content Insights Themes analyses Feed post content only. Email content is not analysed or represented in the Content Insights Themes dashboard.
Note: Within your Poppulo account, you can hover over the info markers on each report tile for further information as needed.
Watch this overview on Content Insights Theme and then read more below.
-
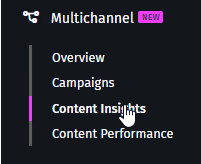
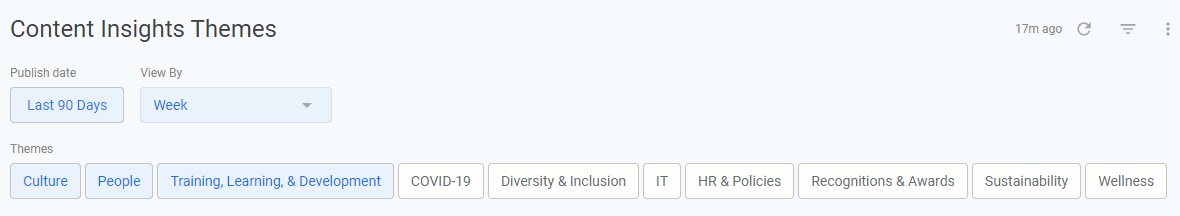
In the Reports area of your account, select Content Insights from the Multichannel menu on the left.
-
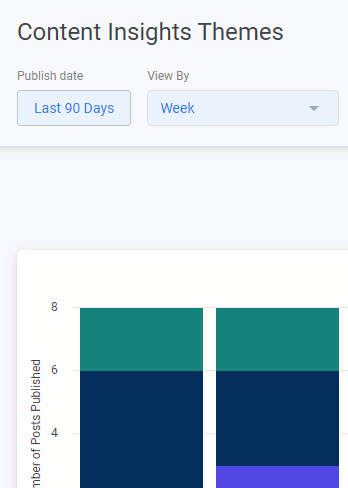
These reports can be filtered by Date Range and Date Granularity, by choosing options in the Date Range and View By drop-downs and selecting the Update button.
You can select or deselect Themes of interest, then press the Update button, as shown below, to filter the dashboard data by those particular Themes.
 Note: All calculations will be based on the filters a user has selected, unless otherwise stated.
- Whenever you make changes to your filter, remember to select the Update button, at the top right of the screen, to view the updated results.

The following section is a break down of each report tile in the Multichannel Content Insights dashboard. Keep in mind that each report is based on your selected Date Ranges and Themes. Only Feeds post content is included in the metrics.
Note: You can also Download Reports, from any of your report tiles, by hovering over the tile, selecting the Tile Actions (the 3-dot icon), and choosing Download data.
Posts per Theme Trend
This chart shows the number of published posts for each detected Theme, displayed as a time series.
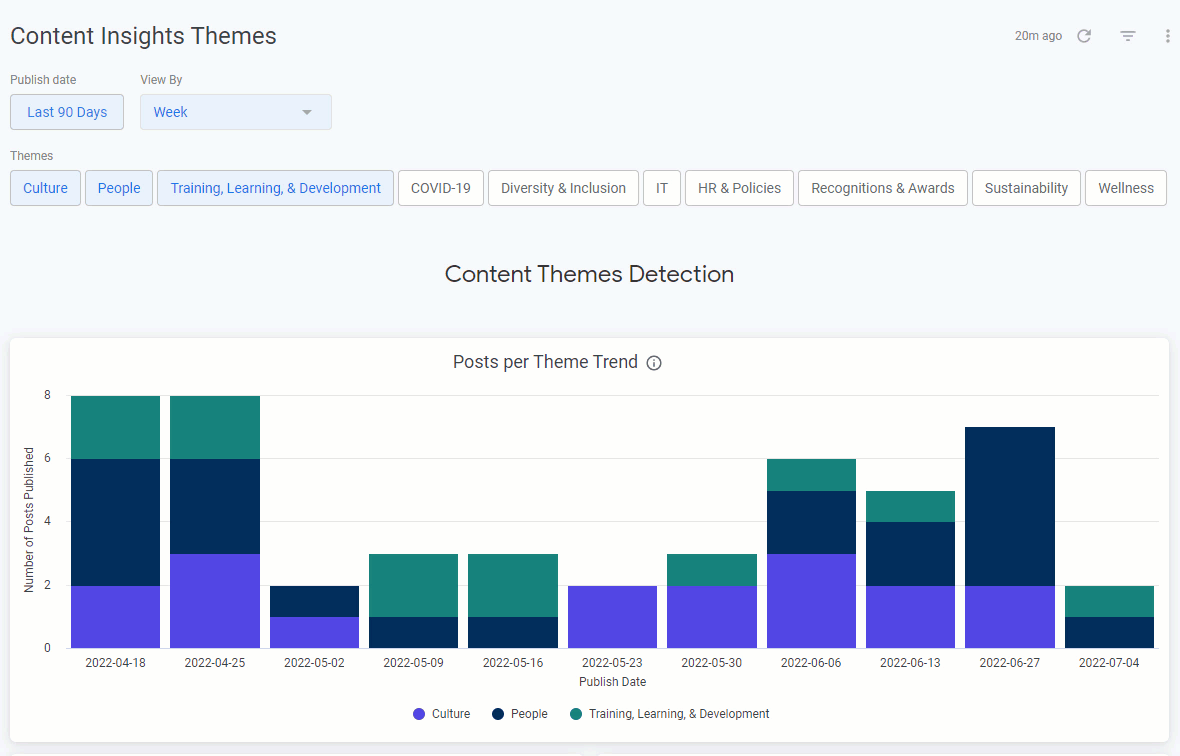
Note: This chart is, by default, filtered by the Themes of Culture, People, and Training, Learning & Development. Diversity & Inclusion is selected, and the updated results reflect the inclusion of the new Theme.
Most Commonly Detected Themes
A ranking of the most commonly detected Themes. This is based on the total number of published posts for each detected theme.
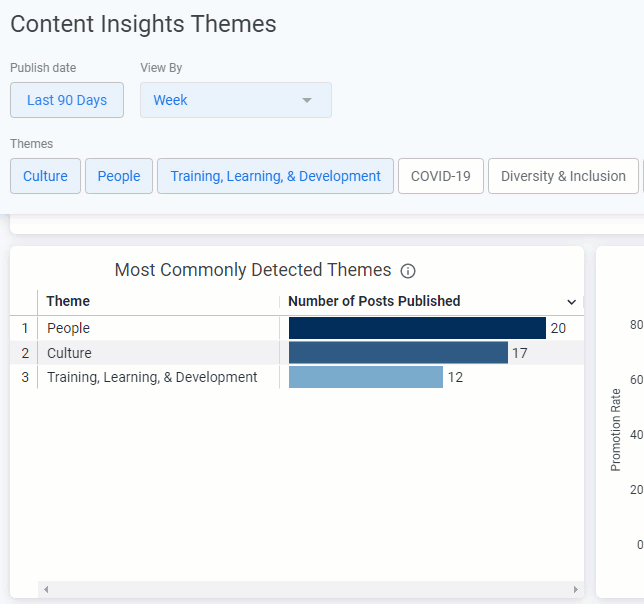
Note: This chart is, by default, filtered by the Themes of Culture, People, and Training, Learning & Development. Diversity & Inclusion is selected, and the updated results reflect the inclusion of the new Theme.
Post Promotion Rate by Theme
This chart shows the percentage of published posts that were Promoted for each detected theme. Promoted posts are defined as either Featured posts or posts that include a Push Notification.
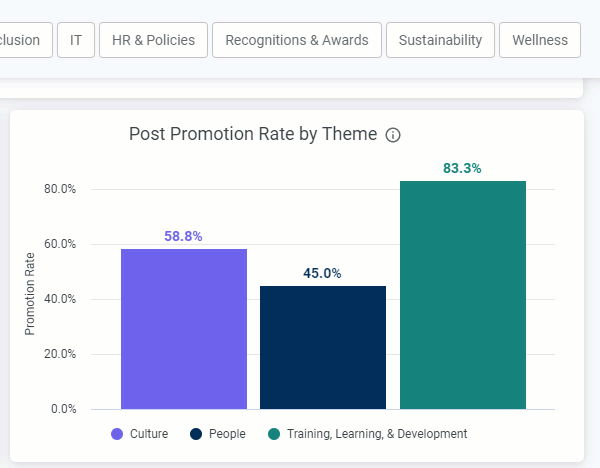
Note: This chart is, by default, filtered by the Themes of Culture, People, and Training, Learning & Development. Wellness is selected, and the updated results reflect the inclusion of the new Theme.
Posts with Detected Themes
This table shows a list of published posts with detected Themes and provides insight on the post Title, Published Date and post Author. Hover over the column headings to reveal sorting options.
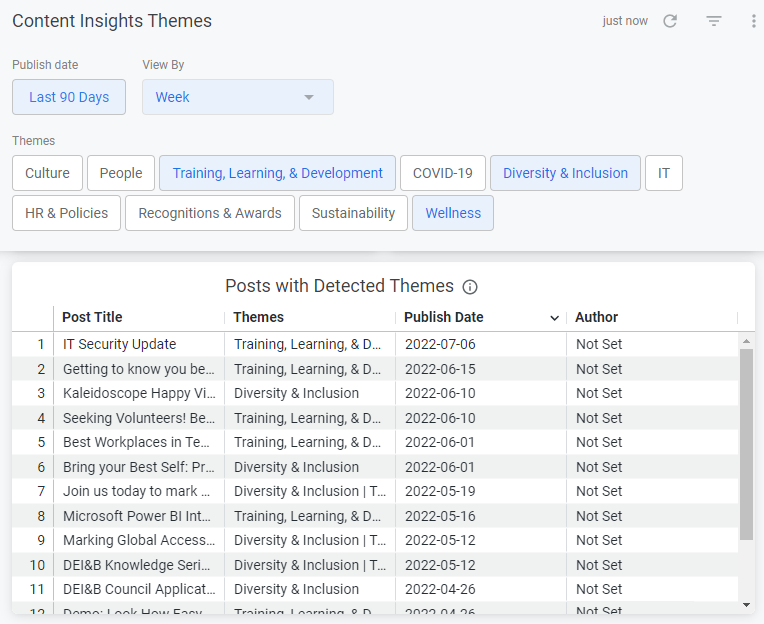
Note: If No Author is listed, the table value for Author will display as Not Set.
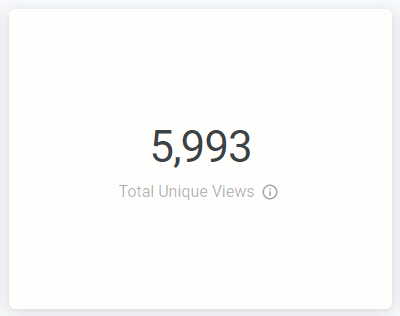
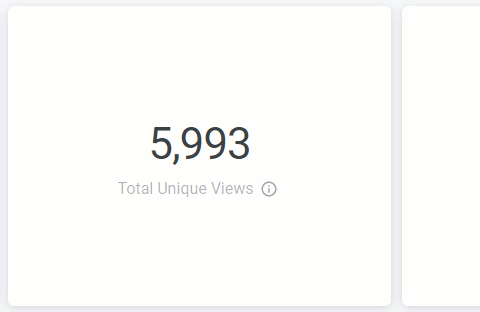
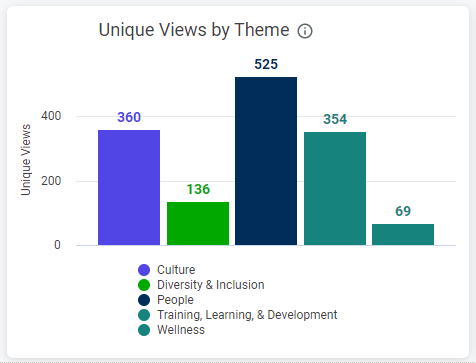
Unique Views by Theme
This chart shows the total unique views of posts for each detected Theme.
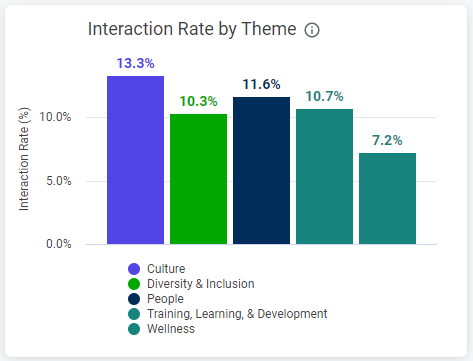
Interaction Rate by Theme
This chart shows the average interaction rate for each detected Theme on published posts. The interaction rate is calculated as the percentage of employees who liked or commented on a post that they have viewed. This tile in particular is a good indicator of which Themes employees most actively engaged with.