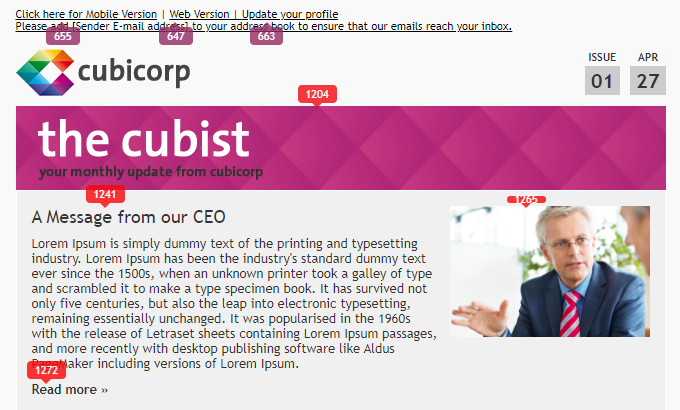
The Click Map helps you to see how your employees are engaging with your emails.
With the help of the Click Map, you can take note of which elements in your email is getting high or low engagement. For example, if you notice your audience is often clicking on images in your emails, that might indicate an interest in visual information, and you may want to include more imagery in your communications, or, if you notice an important piece of content has not been clicked at all, perhaps it needs to be moved to a different part of the Newsletter that has higher engagement.
Click Maps are available for all Flyers and Newsletters, and can be accessed from the Reports Area.
To View the Click Map Reports:
-
.In the Reports area of your account, select Click Map from the menu on the left. Choose a Folder from the drop-down to access reports on that Folder.
-
Choose the Folder, Email and the specific Page you wish to view reports for from the drop-downs.
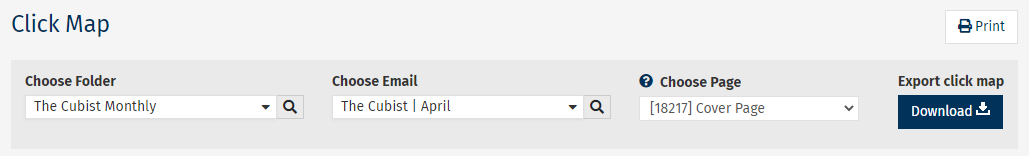
Note: You can also export your Click Map by selecting the Export click map - Download button in the top right corner
-
Your Click Map Report will be generated below based on your chosen options. It shows the total number of clicks on each article, link or element within your Newsletter. You can select any of the numbers to view the specific People who clicked.