The Email Performance dashboard provides detailed list of every Email sent across your Enterprise and individual Accounts. Compare engagement and gain valuable insight on top performing and most opened Emails.
This article provides information on how to find this report, how to filter it, and a break down of the various report tiles within the Email Performance dashboard.
Note: It can take up to 24 hours after an Email send for data to process and display in this report.
Note: Within your Poppulo Harmony account, you can hover over the info markers on each report tile for further information as needed.
This reports is available as an Enterprise and Sub-Account report. At Sub-Account level, data is only related to the Account that you viewing the report in.
The Enterprise Report will display aggregated data for all sending Accounts within your Enterprise.
-
In the Reports Area of your Account, select Performance from the Email reports menu on the left.

-
These reports can be filtered by Sent Date; Standard Date Range filter based on Email send date. You can select from preset or custom date ranges.

The results can also be filtered by Account Name; From Enterprise level you can select one or multiple Sub-Accounts. At Sub-Account level you can only view data for the Account you are within. Select the drop-down arrow to choose the Sub-Accounts of interest.

Select one or multiple Email Folders to view the related data. Select the drop-down arrow to choose your folder.

Select the name of one or multiple individual Emails to view related data.

View results by Campaign. Select the drop-down arrow to choose your Campaign.

- Whenever you make changes to your filter, remember to select the Update button, at the top right of the screen, to view the updated results.
The following section is a break down of each report tile in the
Email Performance dashboard.
Note: You can also Download Reports, from any of your report tiles, by hovering over the tile, selecting the Tile Actions (the 3-dot icon), and choosing Download data. 
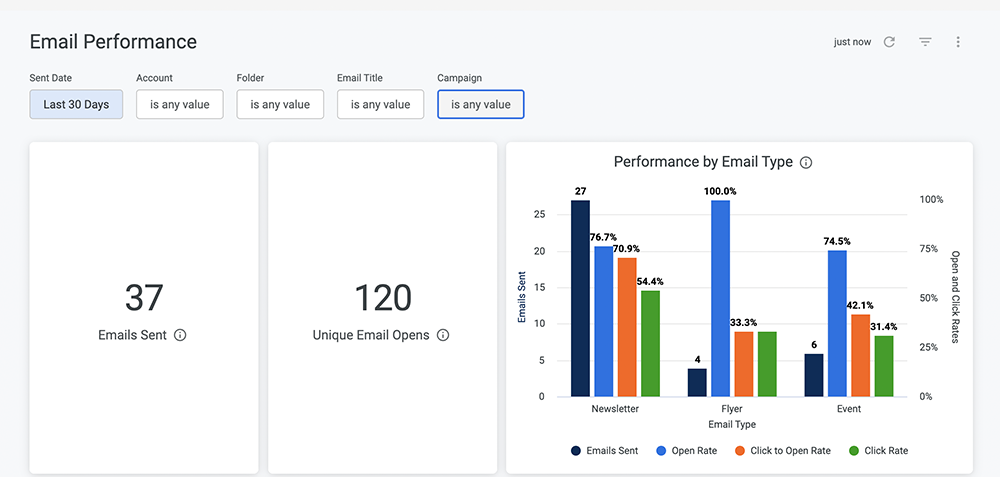
- Emails Sent: Number of unique Emails that have been sent from the Account, within the filters selected.
- Unique Email Opens: The total number of unique Email opens by unique individuals, within the filters selected.
- Open & Click Rates: This bar chart shows the open and click rates for Emails sent, displayed over time with the breakdown of Email type for Newsletters, Flyers and Events.
- Open Rate: Total unique Email opens divided by the total number of Email deliveries.
- Click to Open Rate: Total unique Email clicks divided by the total number of unique Email opens.
- Click Rate: Total unique Email clicks divided by the total number of Email deliveries.
Most Opened EmailsThis table shows top performing Emails with the most Email opens sent, within the chosen date range.
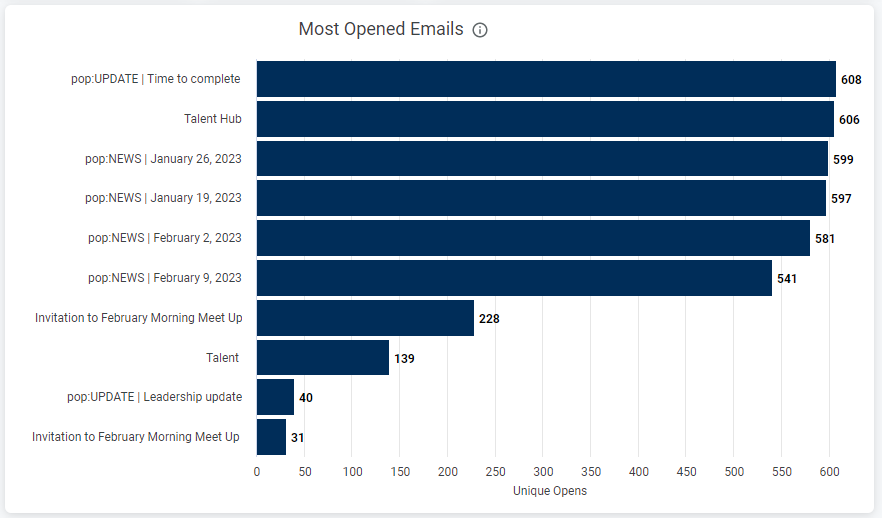 Note: The table is based on the first send date on an Email. Unique Opens for resends of an email are counted.
Performance of Sent Emails This table shows detailed performance metrics for Emails sent. Each column represents a specific metric related to an individual send, including
Deliveries,
Bounces,
Unique Recipients,
Total Opens,
Unique Opens,
Likes & Comments, Campaigns. You can sort the table by clicking the column titles.

You can view more columns by using the scrollbar at the bottom of the table.
Related Articles:
