When you Create a Custom Report, there are several report types to choose from. Each different report type will help you target the specific data which suits your organisational needs.
The Trending Report across Multiple Accounts and Folders shows selected metrics for single or multiple mailings across a number of Folders or accounts. To create a Trending Report across Multiple Accounts and Folders, follow the instructions below:
To Run a Trending Report across Multiple Emails filtered by Field or Tag:
-
Create a Custom Report
-
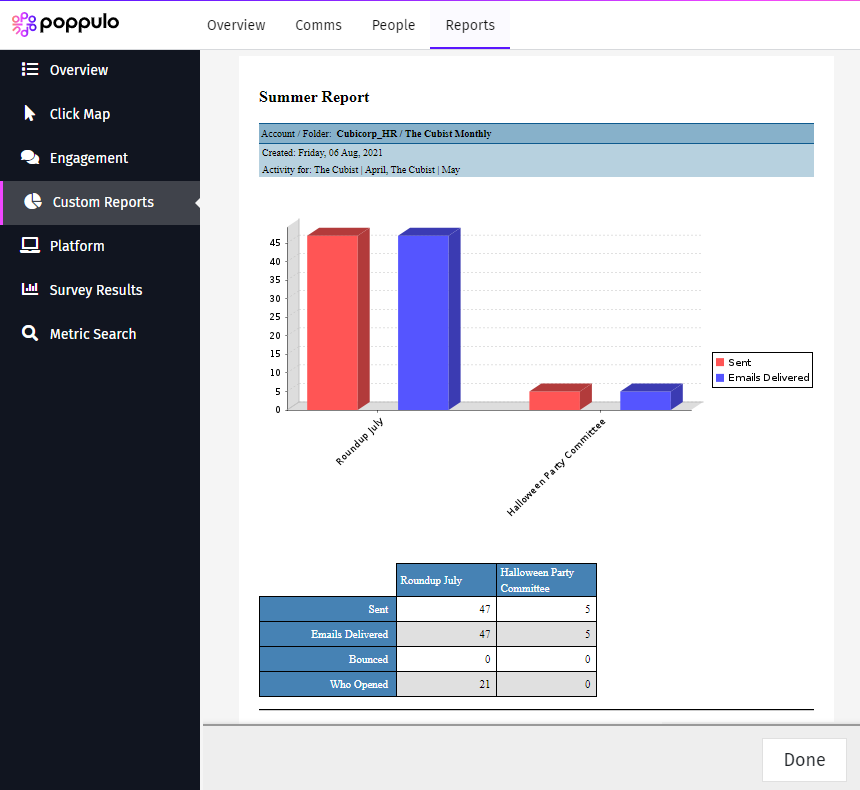
On the Custom Reports screen, click the New Report button.
-
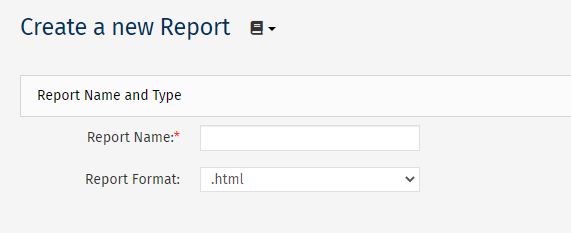
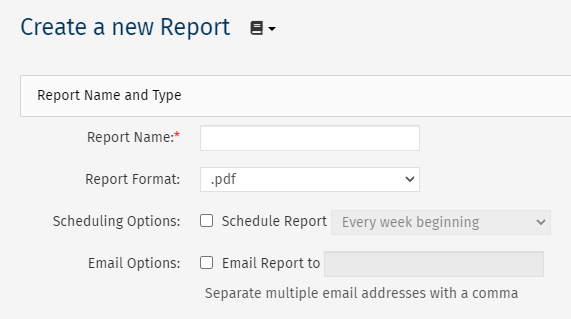
Create a new Report screen.
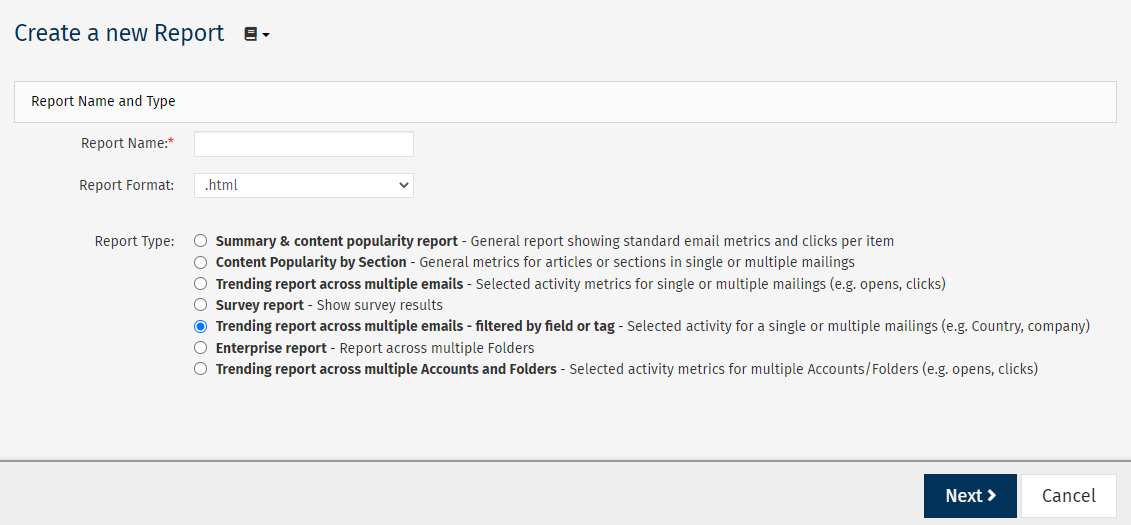
Enter the Report Name and choose your preferred Report Format for viewing the data.
Note: Choosing .pdf, .csv or .xls, as the Report Format will reveal Scheduling Options and Email Options for your report. (see below)
-
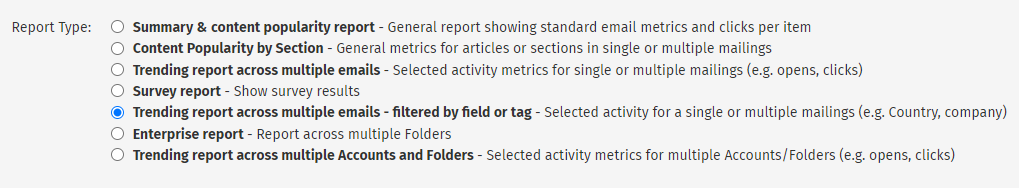
In the Report Type list, choose the Trending report across multiple emails - filtered by field or tag option, then select Next to continue.
- Create a new Report: Choose Parameters screen.
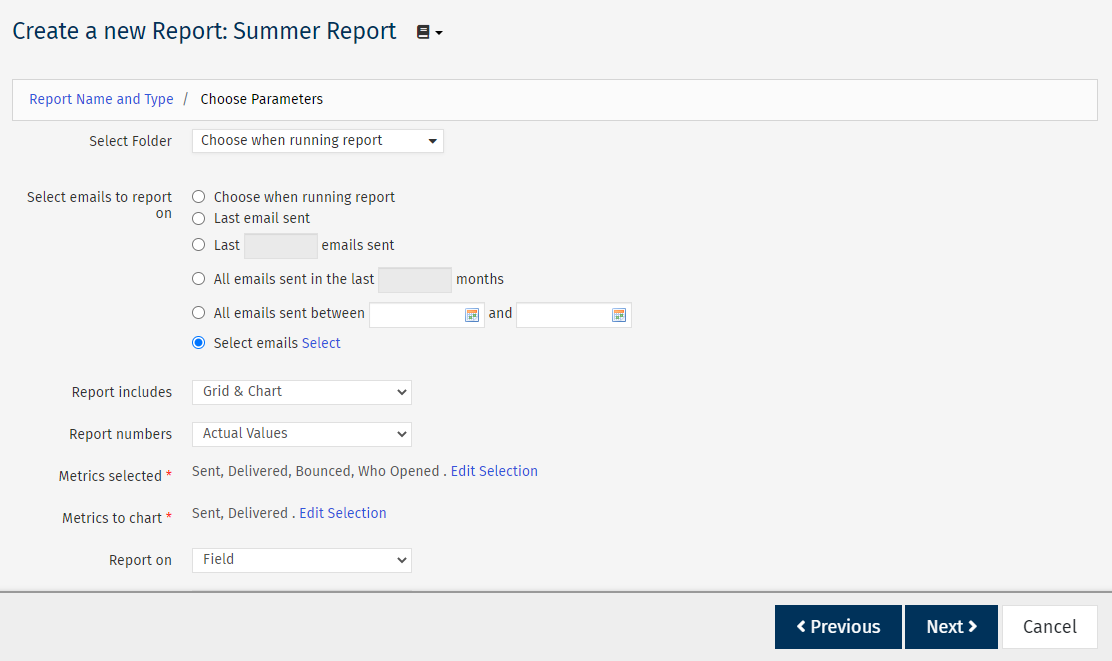
Choose a Folder from the Select Folder drop-down, then choose an option from the Select emails to report on radio buttons. These are the emails that your report will be based on.
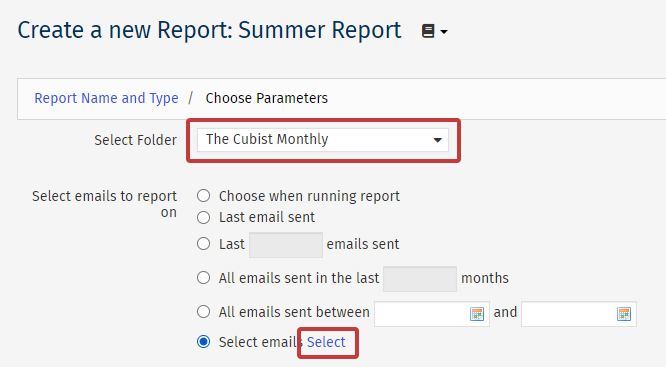
In this example, Select emails has been highlighted. With this option you'll need to click on the highlighted Select text to choose your emails from a list of your communications in your chosen Folder.
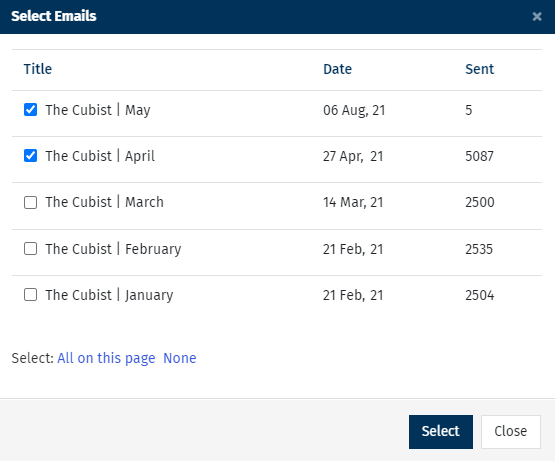
Note: If you select choose when running the report from the Select Folder drop-down, you will not be able to select specific emails, as highlighted above.
-
Complete the additional parameter options, then choose Next.
-
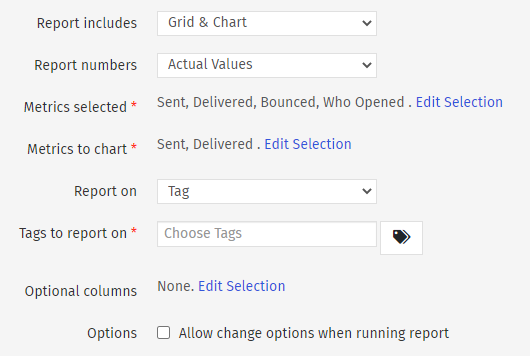
Report includes - Choose whether your data is displayed in a Grid, Chart or both in your report.
-
Report numbers - Choose whether your figures are displayed as Actual Values, Percentages or both in your report.
-
Metrics Selected - Choose the metrics to appear in the grid.
Note: Sent, Delivered, Bounced and Who Opened will be selected by default.
-
Metrics to chart - Choose the metrics that will appear in the chart.
Note: Sent and Delivered will be selected by default.
-
Report On - Choose whether to report on a field or tag (Tag is selected in this example).
-
Field to report on/Tags to Report on - Choose which Field or the Tag to report on.
-
Field values selected - If you choose to report on a field, select the field values of the employees to include in your report. For example, if you choose to report on the field Country Name - you may only want to include People that have the country Ireland, United Kingdom or United States as this field value in your reporting figures.
-
Optional columns - Choose if you'd like to include the additional columns of the selection average and/or distinct figure.
-
Options - Selecting this checkbox allows you to make changes when running the report.
-
Choose to filter by Saved Search (or not), then choose Next.
-
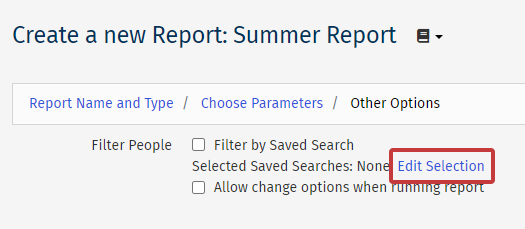
Filter People - This allows you to run your report on a specific group of employees, excluding those not in your selected saved search. Use the checkbox to enable the filter and then and click Edit Selection to choose a Saved Search.
Note: Checking the Allow change when running the report checkbox will enable you to choose, or choose to overwrite, your filters when running your report.
- Review your Custom Report, then click Save to complete
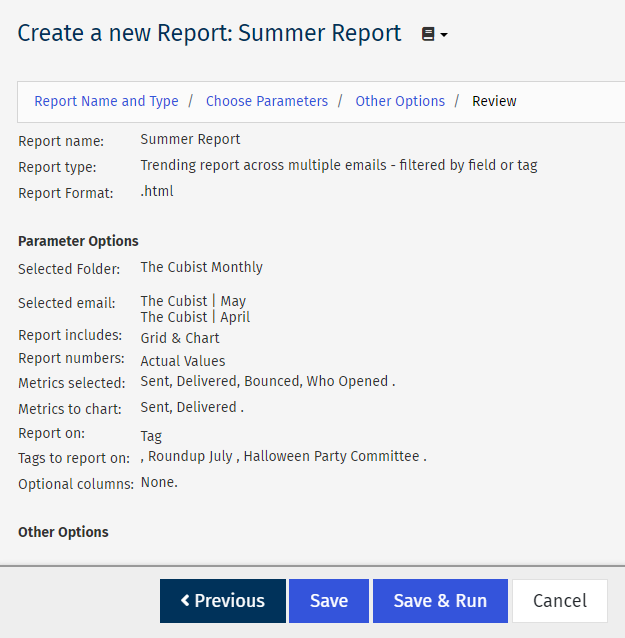
Note: The Review page is a complete summary of all information entered during the Create a Report Wizard. Review this information carefully to ensure your report accurately targets the data you would like to capture.
(Alternatively click Save & Run to run the report straight away.)