When you Create a Custom Report, there are several report types to choose from. Each different report type will help you target the specific data which suits your needs. The Survey Report is a report showing the results of a selected survey. To create a Survey Report, follow the instructions below:
To Create a Survey Report:
-
Create a Custom Report
-
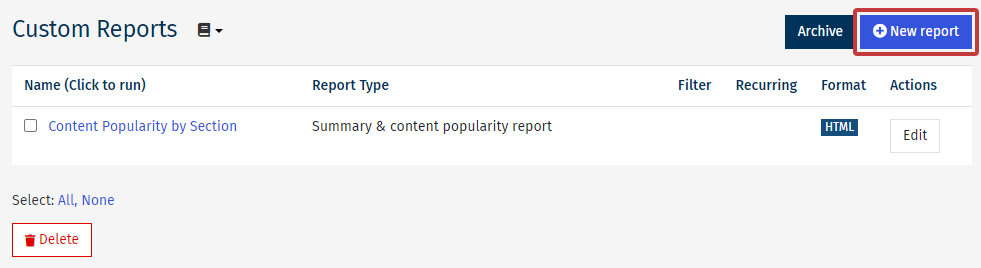
On the Custom Reports screen, select the New report button.

-
The Create a new Report page is where you can choose your Report Name, Format and Type.
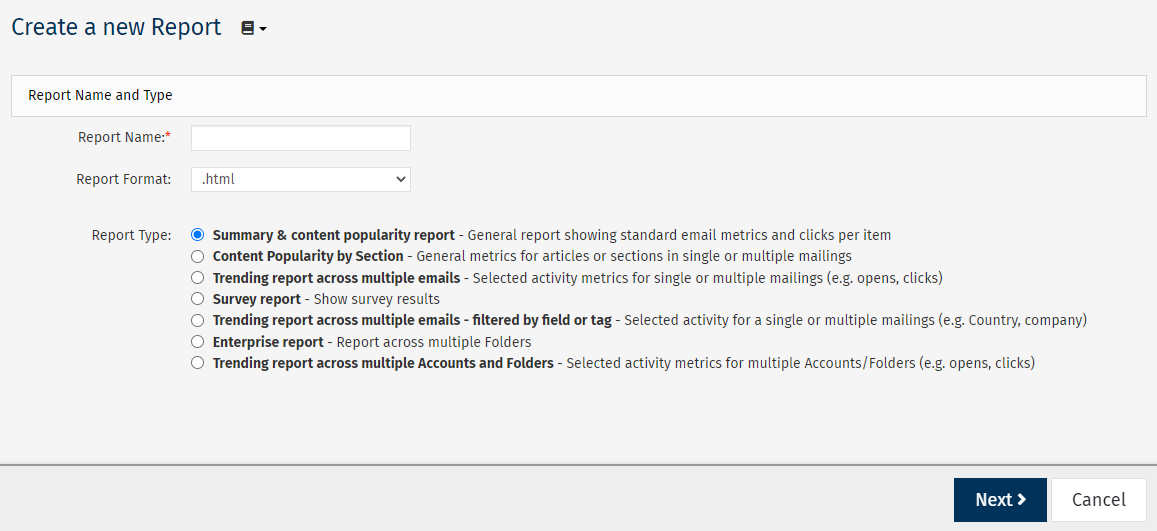
Enter the Report Name and choose your preferred Report Format for viewing the data.
Note: Some report formats have a limit on how many emails you can report on. Limits - PDF(.pdf): 60 emails, Excel(.xls): 200 emails.
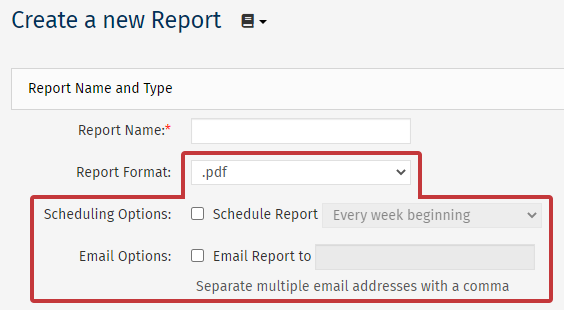
Choosing .pdf, .csv or .xls, as the Report Format will reveal additional Scheduling and Email Options (see below).
-
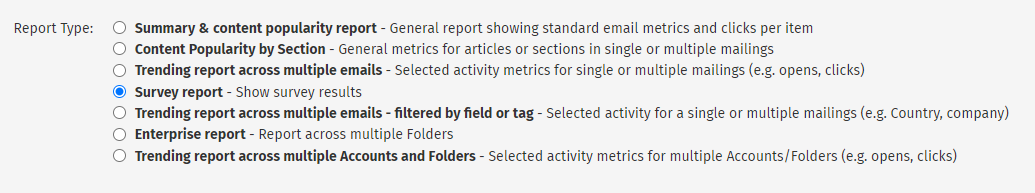
Choose the Survey report radio button under Report Type and click Next to continue.
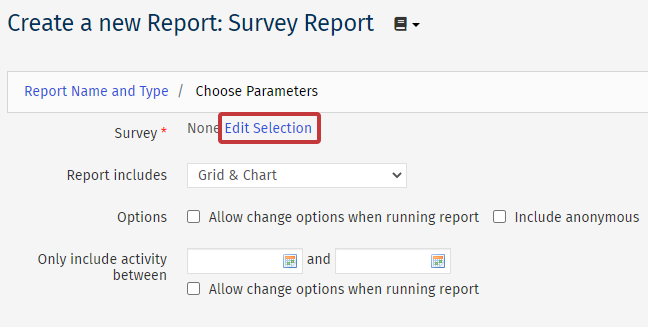
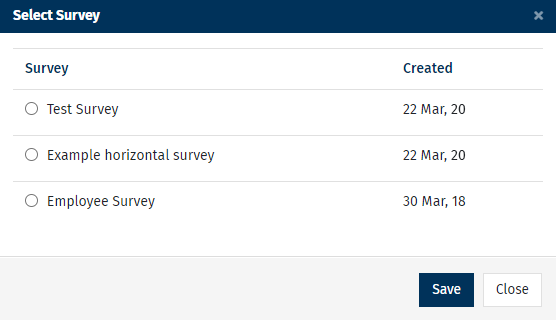
- On the Choose Parameters screen, select Edit Selection, Next to the Survey heading, and choose the survey you want to report on.
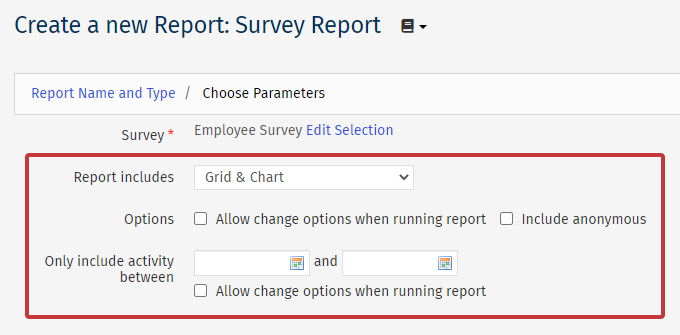
Make edits to the parameters where necessary, then click Next.
-
Report includes - Choose to include Grid, Chart or both in your report.
-
Options - Allow change when running report: Refers to changing the selected survey and grid/chart options when running the report. - Include anonymous: Selecting this includes answers from anonymous people that completed the survey (i.e. not People).
-
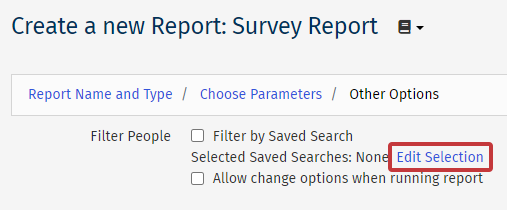
Choose whether to Filter People by Saved Search (or not).
-
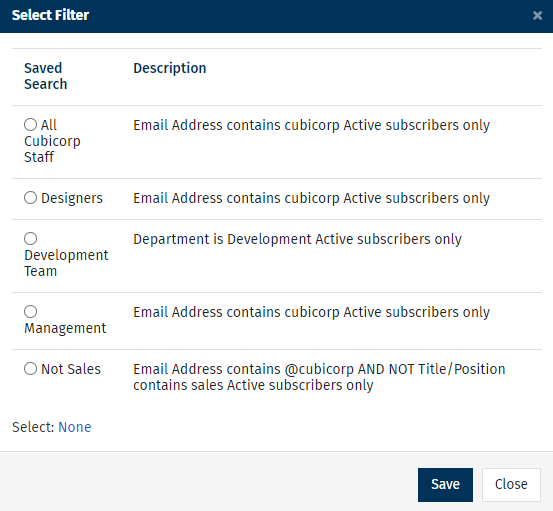
Filter People - This allows you to run your report on a specific group of employees, excluding those not in your selected saved search. Use the checkbox to enable the filter and then and click Edit Selection to choose a Saved Search.
Note: Ticking the 'Allow change options when running report' check box will enable you to choose, or overwrite, your filters when running your report.
- Review your Survey report and then select Save. (Alternatively select Save & Run to run the report straight away.)
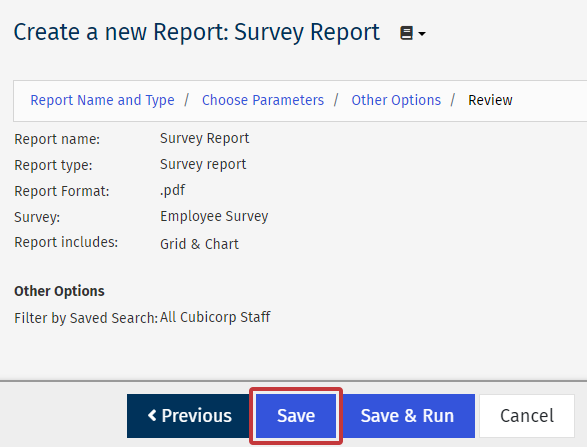
Note: The Review page is a complete summary of all information entered during the Create a Report Wizard. Review this information carefully to ensure your report accurately targets the data you would like to capture.
