Feature Availability
This feature is only available on certain Poppulo packages. For more details, see our packages and pricing page
Poppulo
Analyze Agent is a conversational AI assistant that helps you explore and understand communication performance quickly and intuitively. Instead of digging through dashboards or building detailed reports, you can request specific insights using natural language, from open and click-through rates to trends over time, audience and department comparisons, and content-level signals. Analyze Agent then retrieves, interprets, and presents the results in a clear, structured way so you can move from data to action faster.
Getting Started
Analyze Agent is designed to help you quickly uncover insights from their communication data. You can ask questions in natural language, refine follow-up prompts, and generate visualizations to better understand communication performance and engagement trends.
To get started, try prompts such as:
- “Which communications had the highest click-through rate in the last 30 days?”
- “What themes are driving the most engagement?”
- “Compare engagement trends between departments this quarter.”
- See more example prompts >
For the best results, keep prompts focused and include details such as timeframe, audience, communication type, or metric.
Access the Analyze Agent
The Analyze Agent is available at both Enterprise and Sub-Account level. The Analyze Agent can only access the data that your permissions allow. For example, if you only have access to certain sub-accounts, the Agent will only analyze data related to those sub-accounts.
- From the Home page of your account, click Reports.
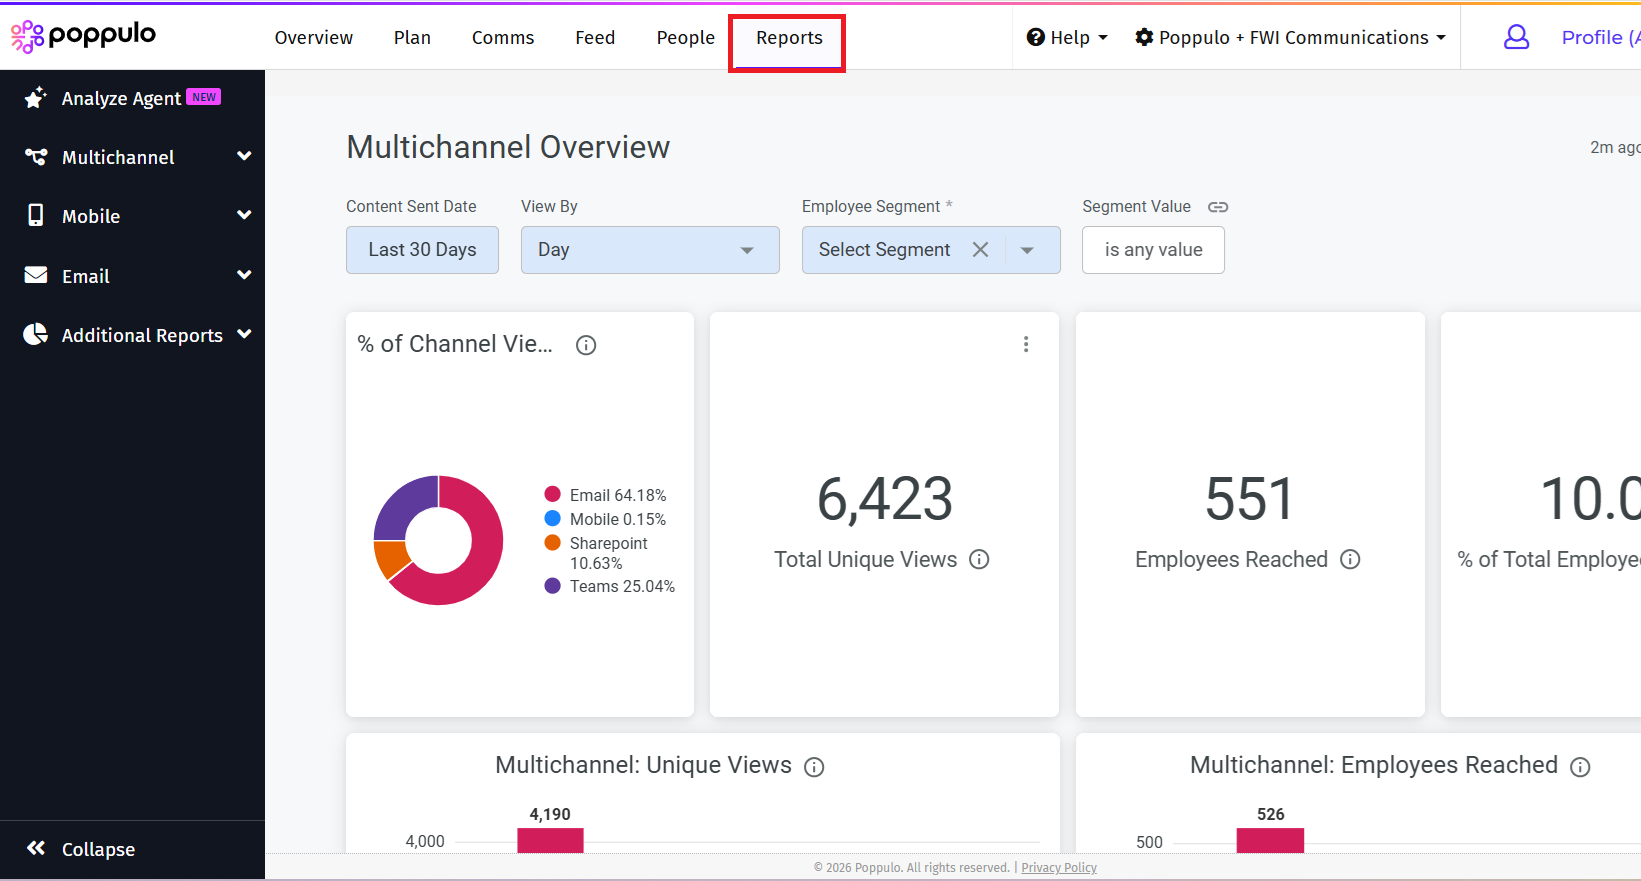
- From the left navigation, select Analyze Agent.
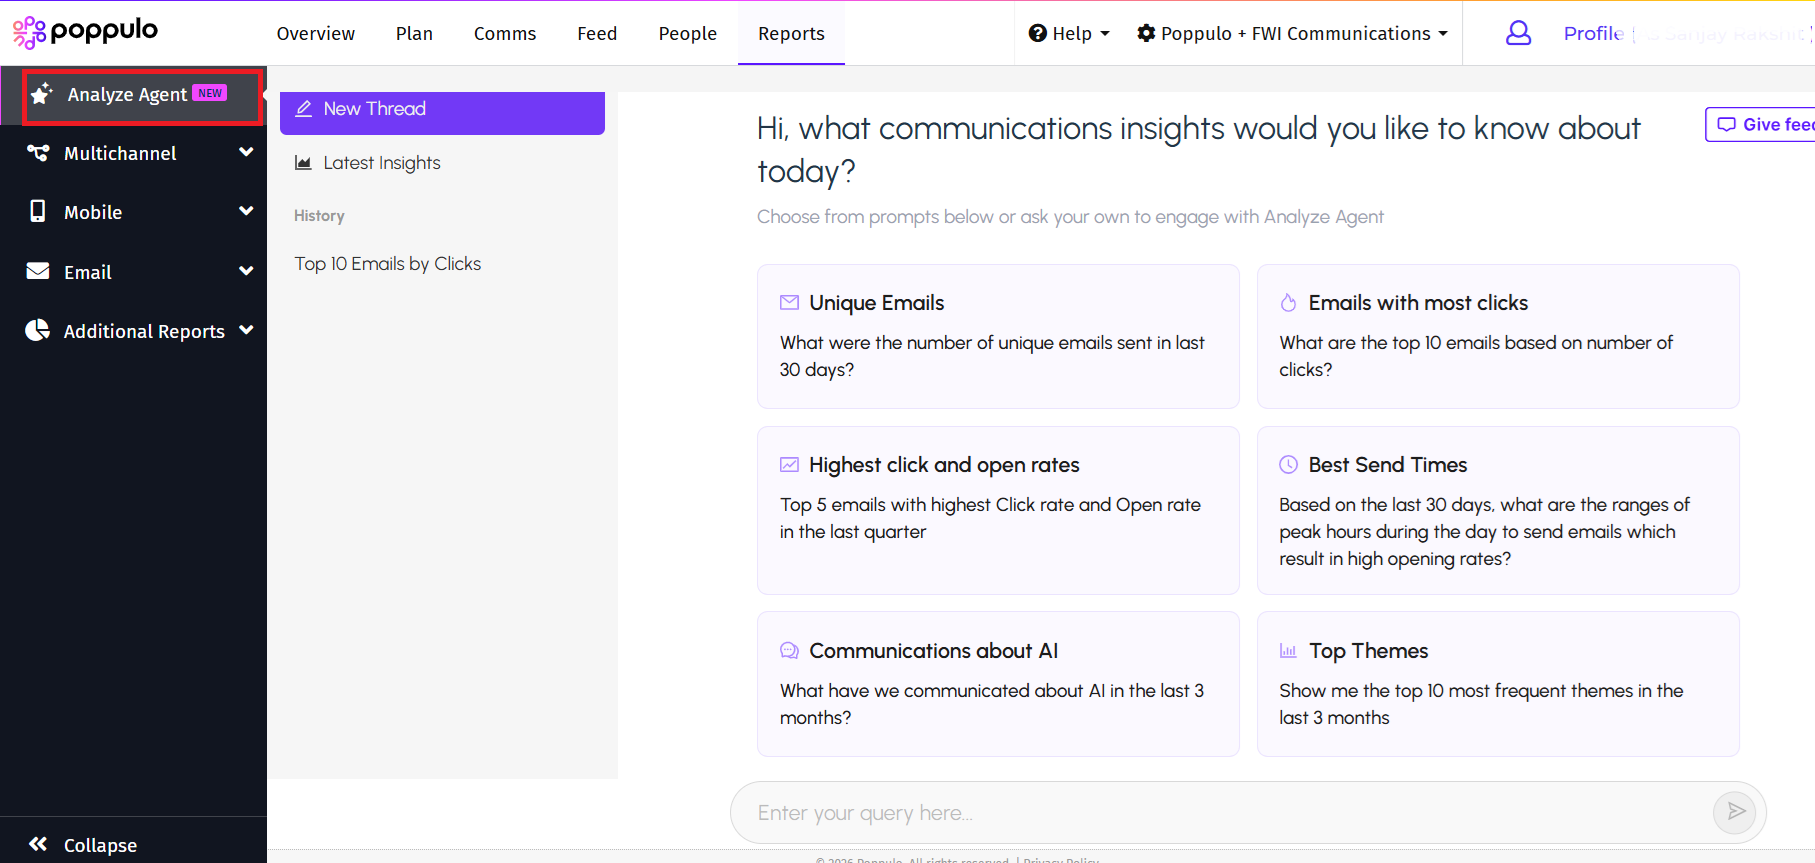
Note: It is mandatory that "Advanced Reports" is enabled in your account to access the Analyze Agent. You must also accept Poppulo AI Supplement Terms to use Poppulo AI features.
Upon first use, the Agent will automatically run a query "What are the latest insights and updates?". This query reviews communication activity from the past 30 days and responds with a summary of communications performance and other insights such as busiest send times.
Start a New Query
You can run multiple queries in the Analyze Agent based on your requirement. To start a new query in Analyze Agent,
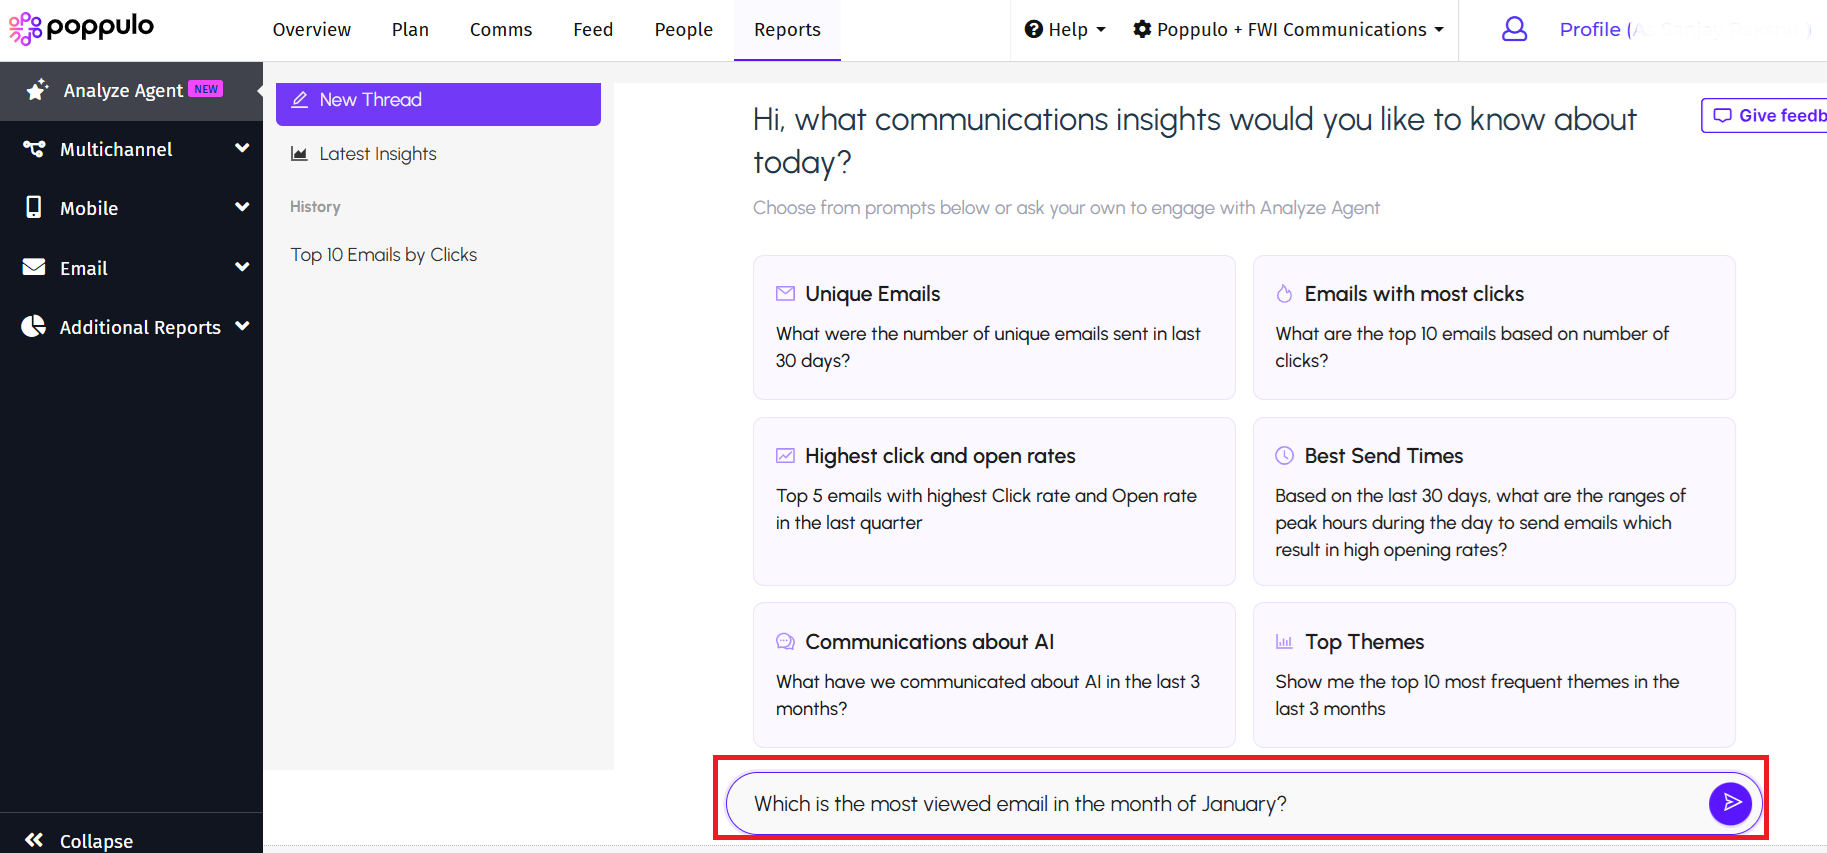
- On the Analyze Agent screen, click the Prompt area to enter your query.
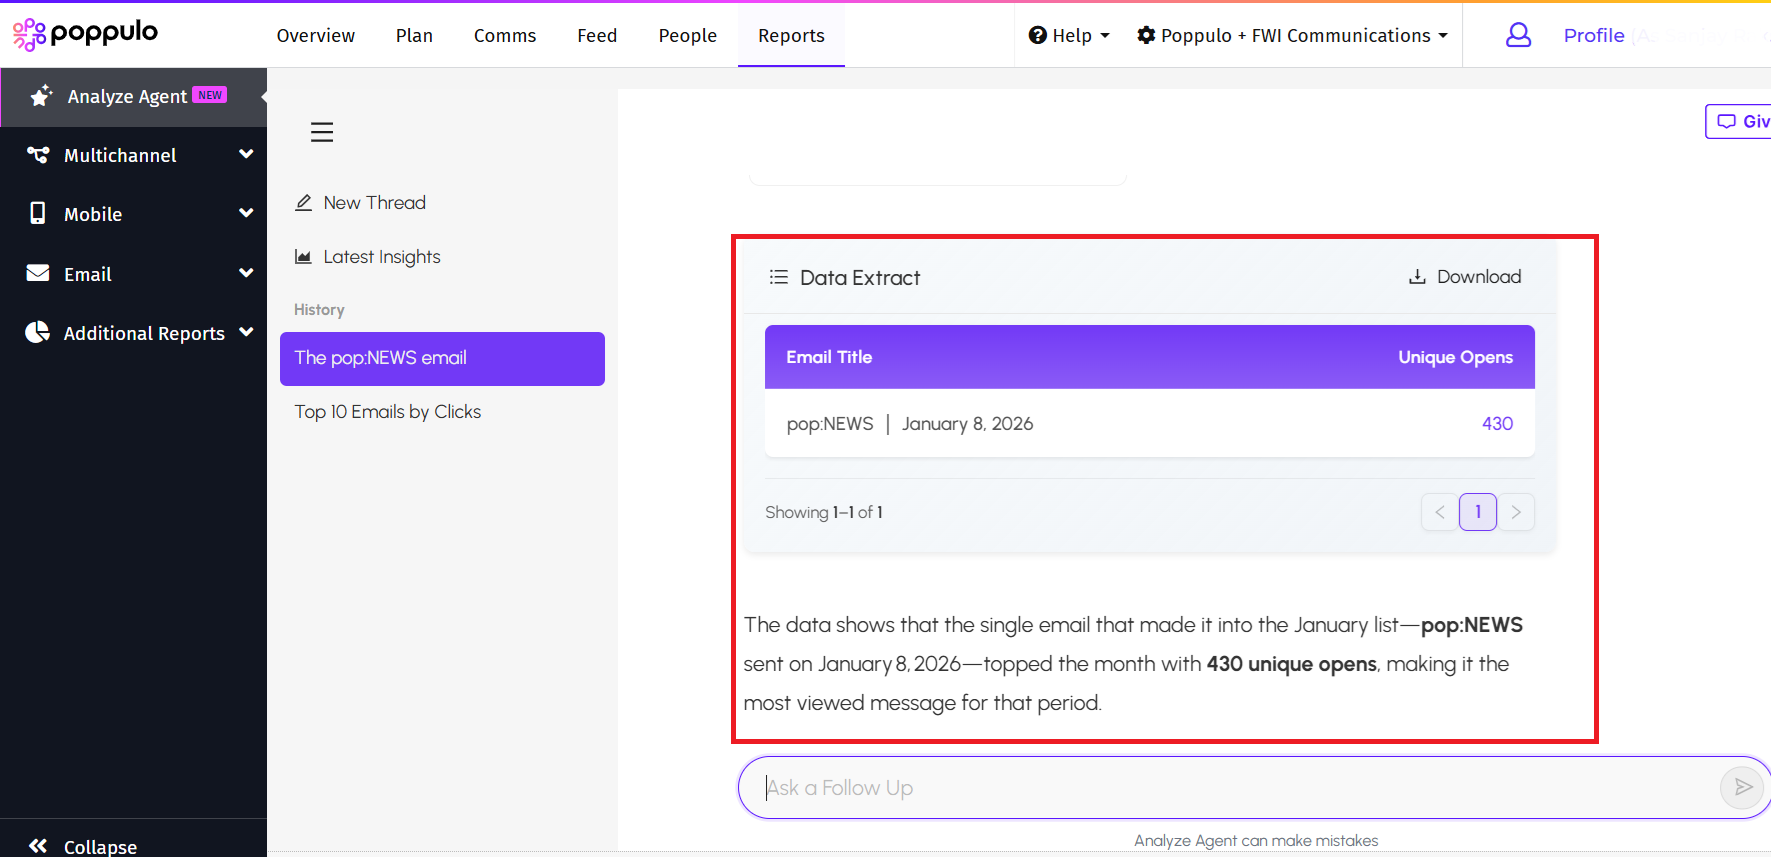
- Type your query into the Prompt area. For example, entering 'Which is the most viewed email in the month of January', prompts the agent to run the query and display the results. The following images illustrate both the query and its corresponding output.
Additionally, you can queue up to three queries in the prompt area, and the agent will execute them sequentially, providing the results for each.
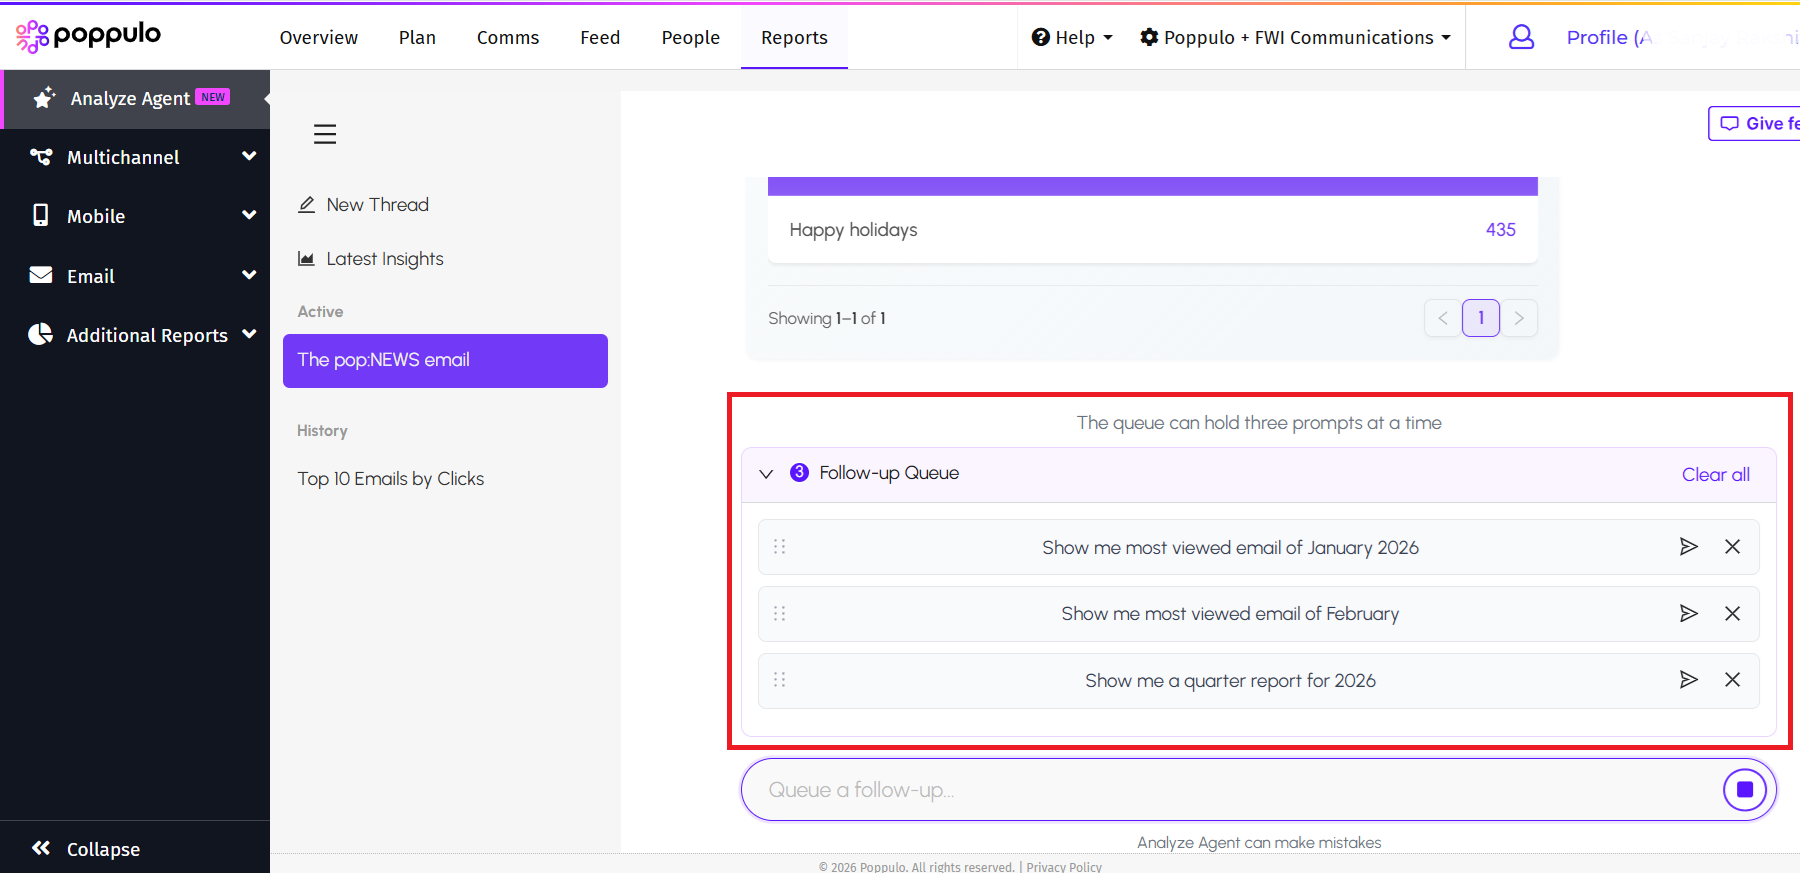
If you want to run a report for a specific query in the queue, click the arrow icon next to that query. The agent skips the remaining queued queries and runs the report for the selected one.
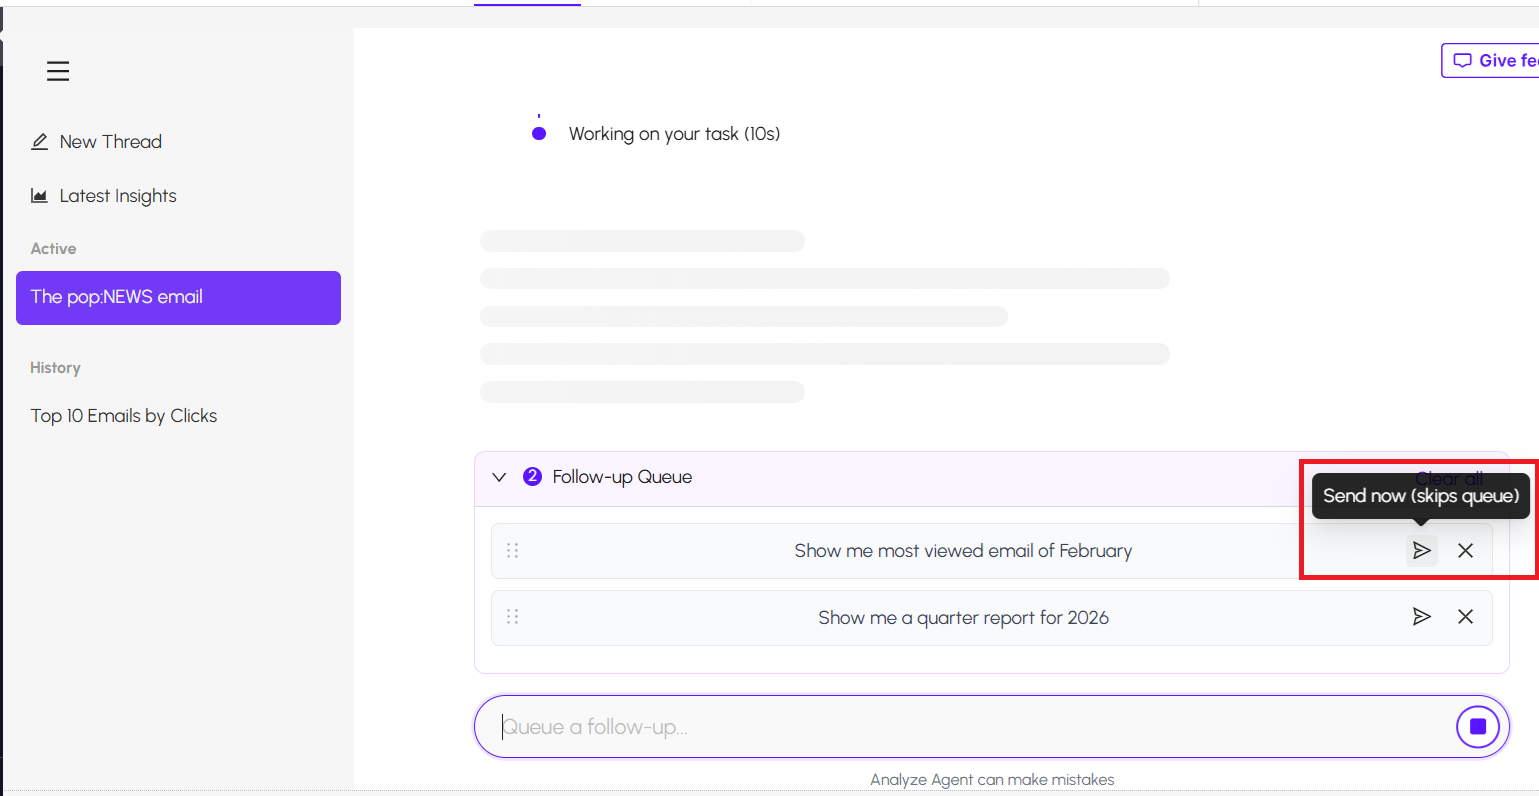
Before submitting the query, ensure that any earlier prompt results have completed. Otherwise, the agent cancels the in-progress results and runs the report for the currently selected query.
The agent can run a report for only one query at a time.
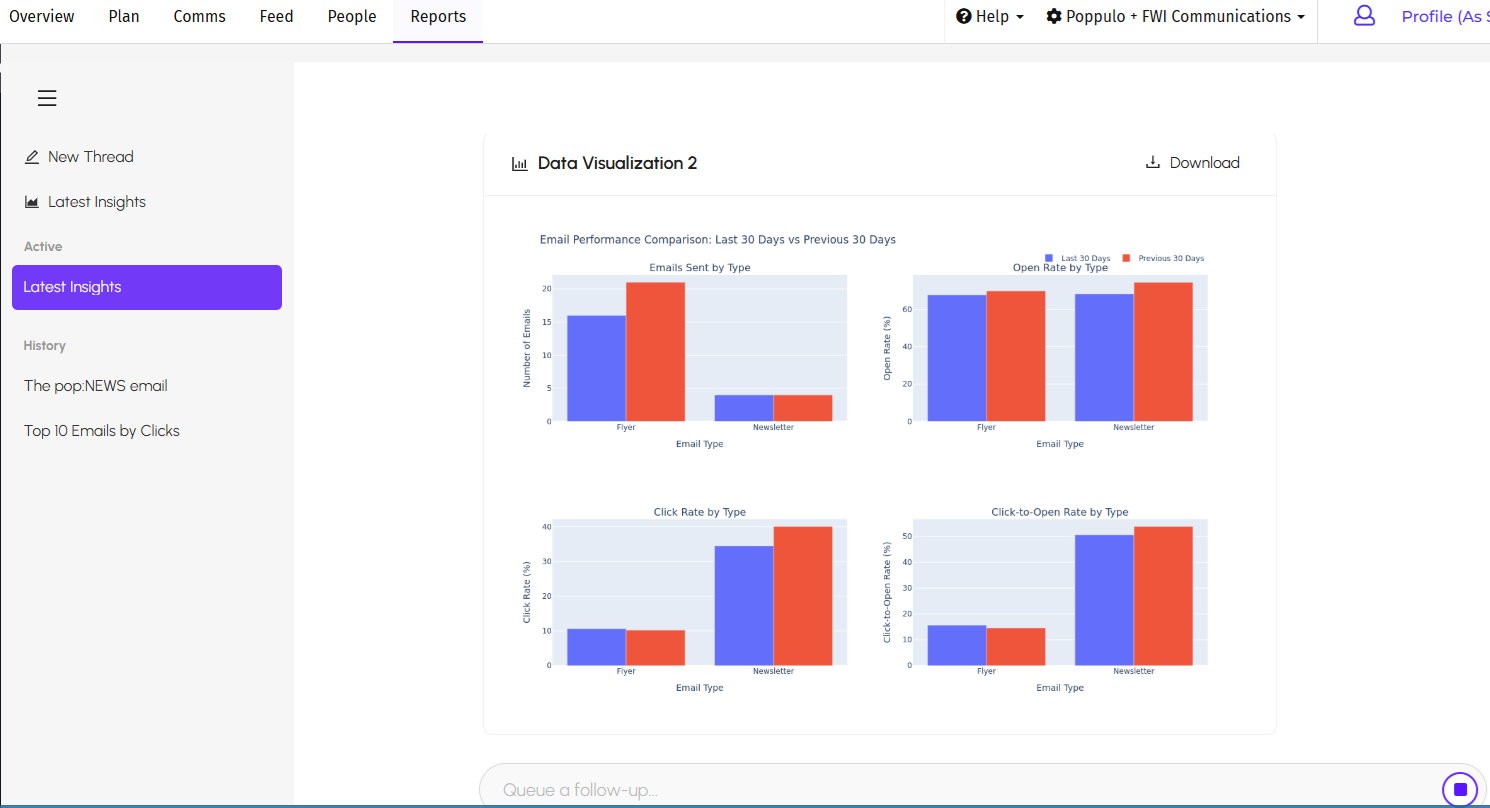
Visualization
The Agent often responds with charts and other visualizations. You can also prompt the agent to provide you with visualizations that help you better interpret results or to share with others.
If you would wish to download the visualizations, you can click Download on the top right corner of the visualization.
View What Sources the Agent Has Used
Analyze Agent provides the sources that it used to generate the response to help you validate the responses provided by the agent.
To view the sources,
- Click the Show all button next to the Sources.
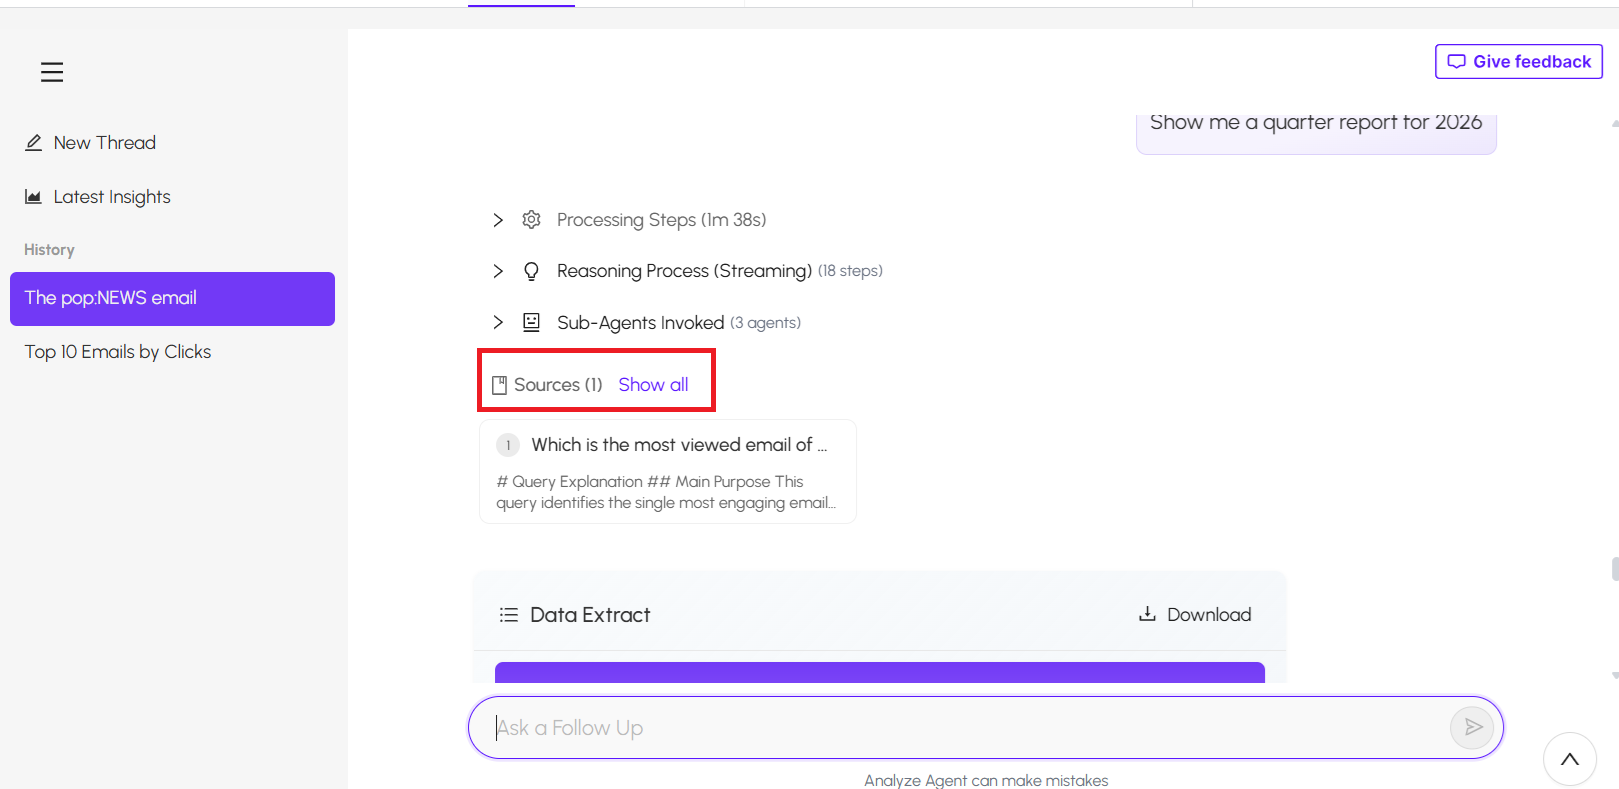
The list of all the sources that the Agent used are populated in the
Sources panel that opens on the
right-hand side.
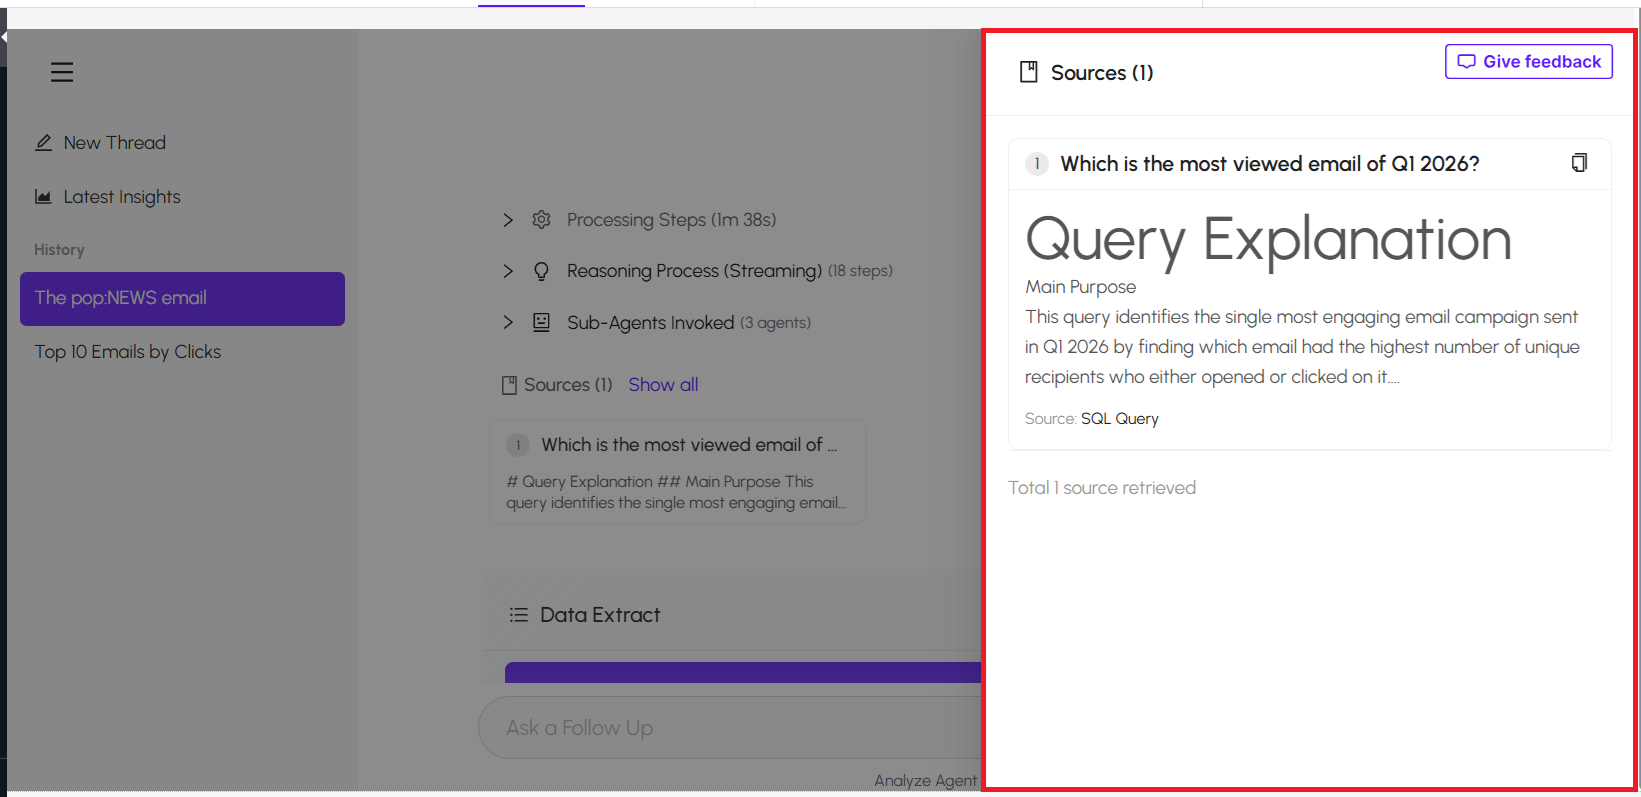
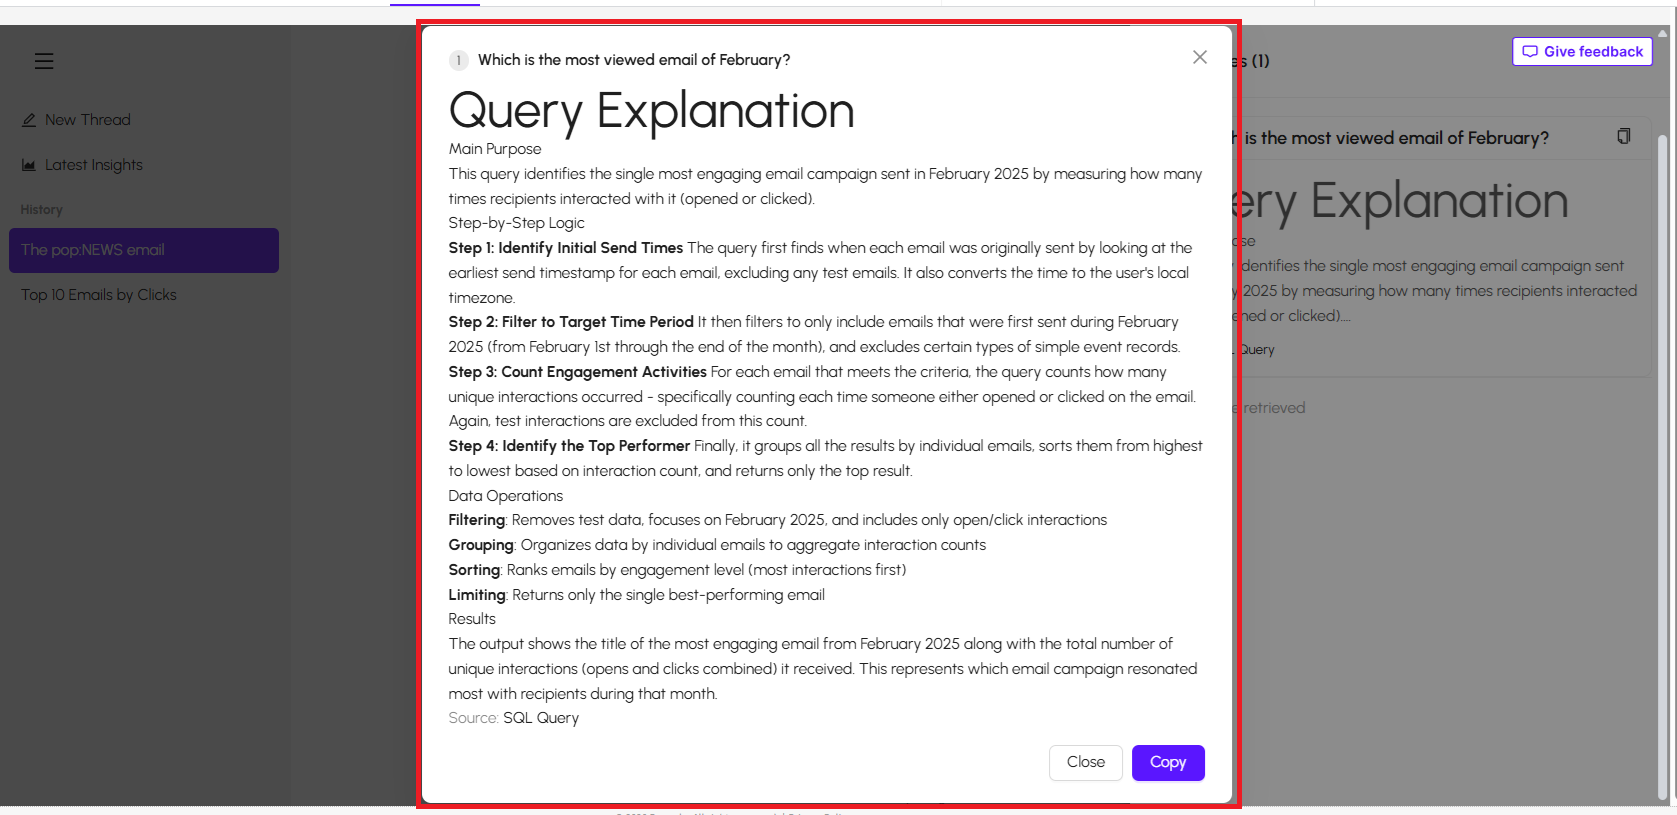
- Click the source to view the details in a Pop-up window. You can click Copy to copy the information to clipboard.
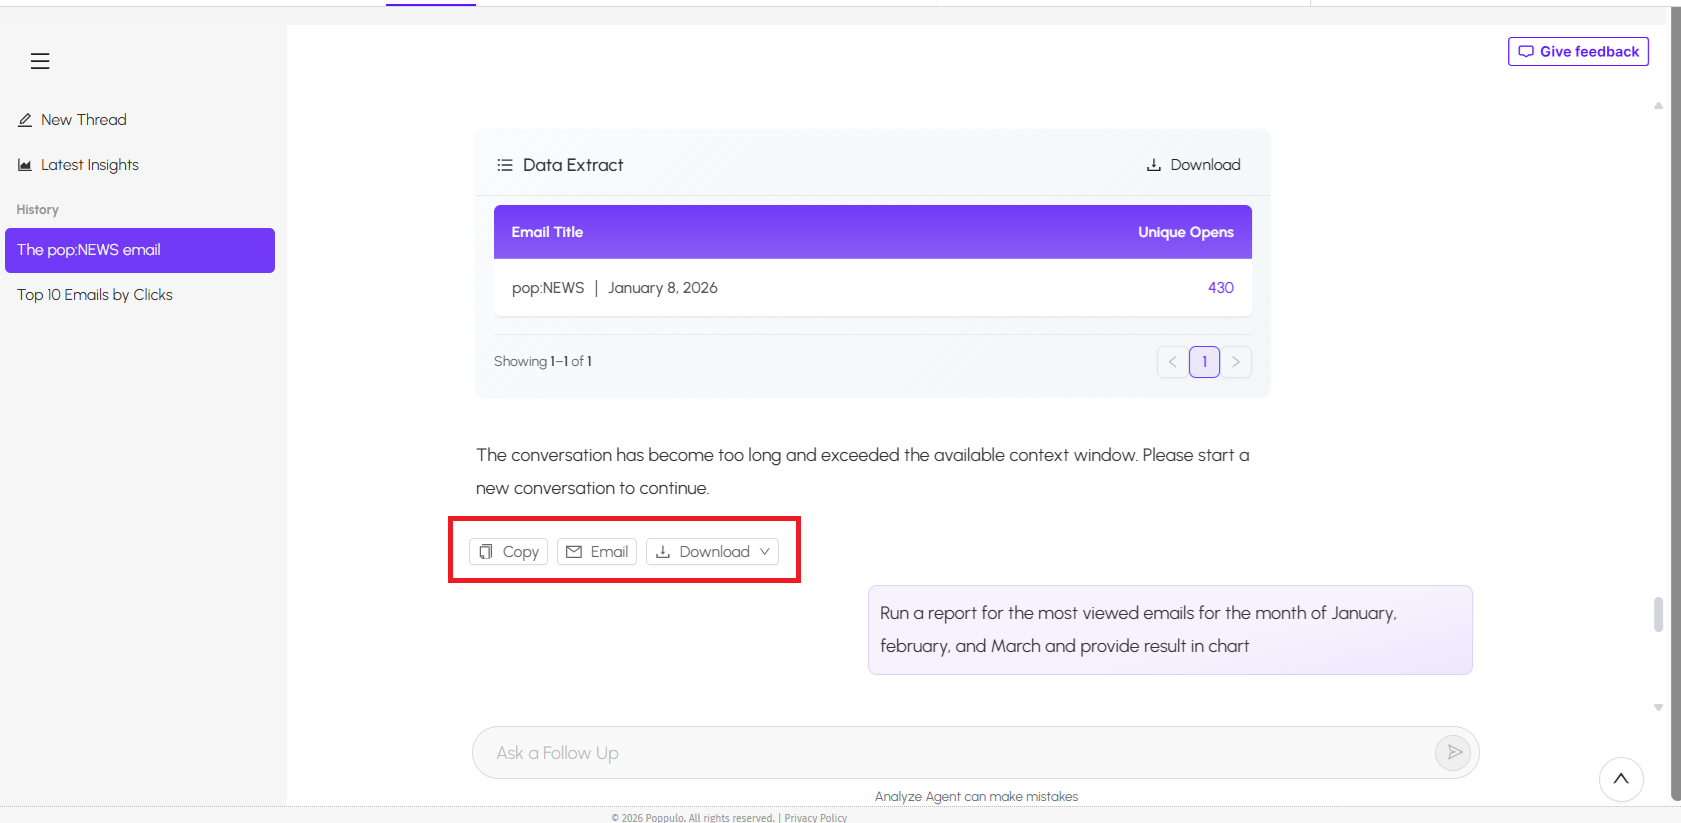
Export and Copy
At the bottom of the result or conversation, there are options to export and share information.
- Copy - allows you to copy the information to clipboard
- Email - allows you to share the information via email with other recipient.
- Download - allows you to download the information. By default, the file is downloaded in Marked Down format. However, you can view the file in either Word or PDF format.
Delete a Thread
If you wish to delete a thread from the chat area,
- Navigate to the thread that you wish to delete.
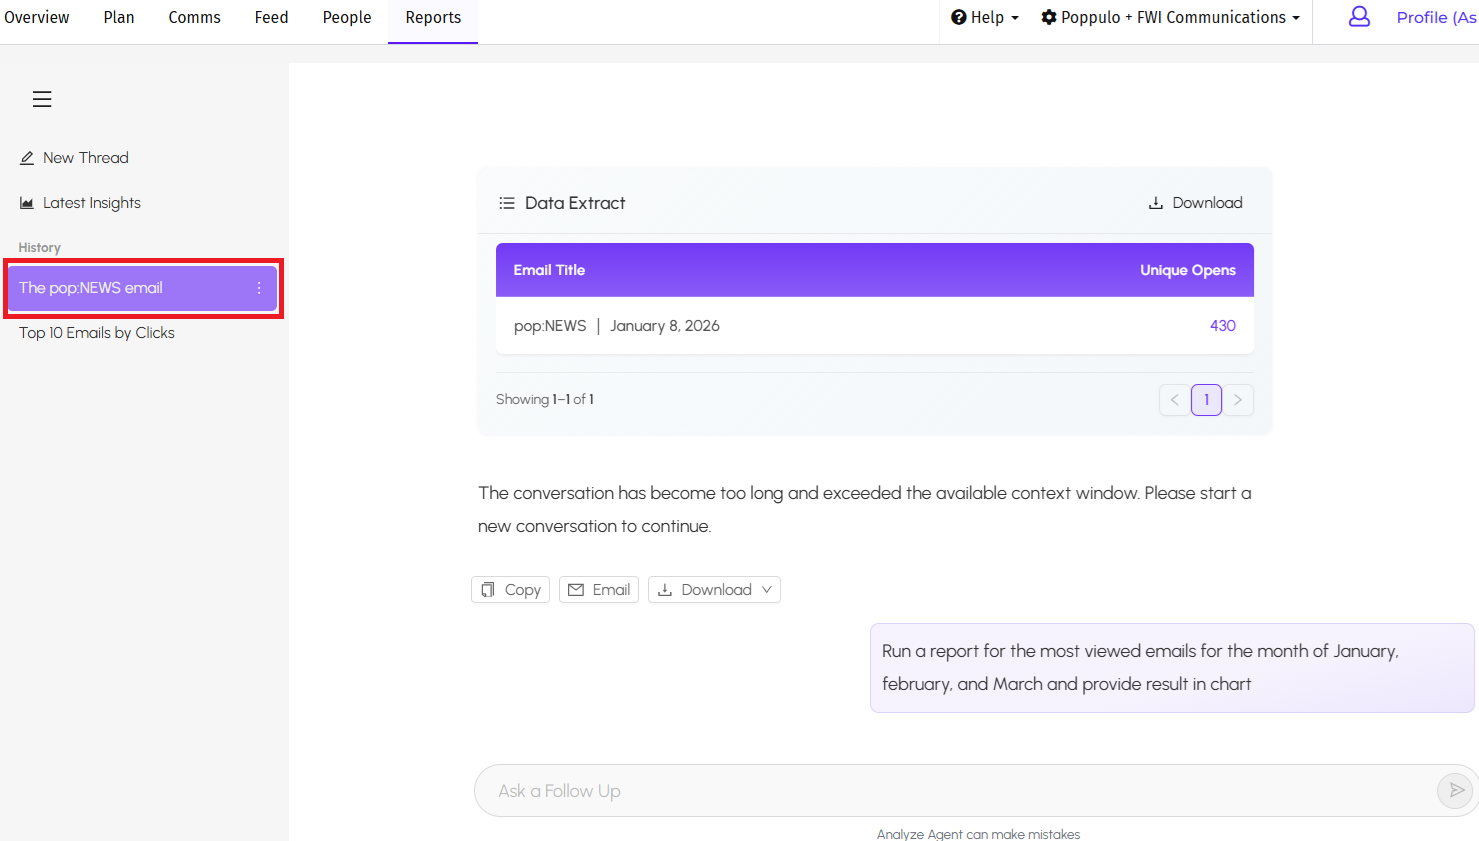
- Hover over the three dots and click Delete. The selected thread will be deleted.
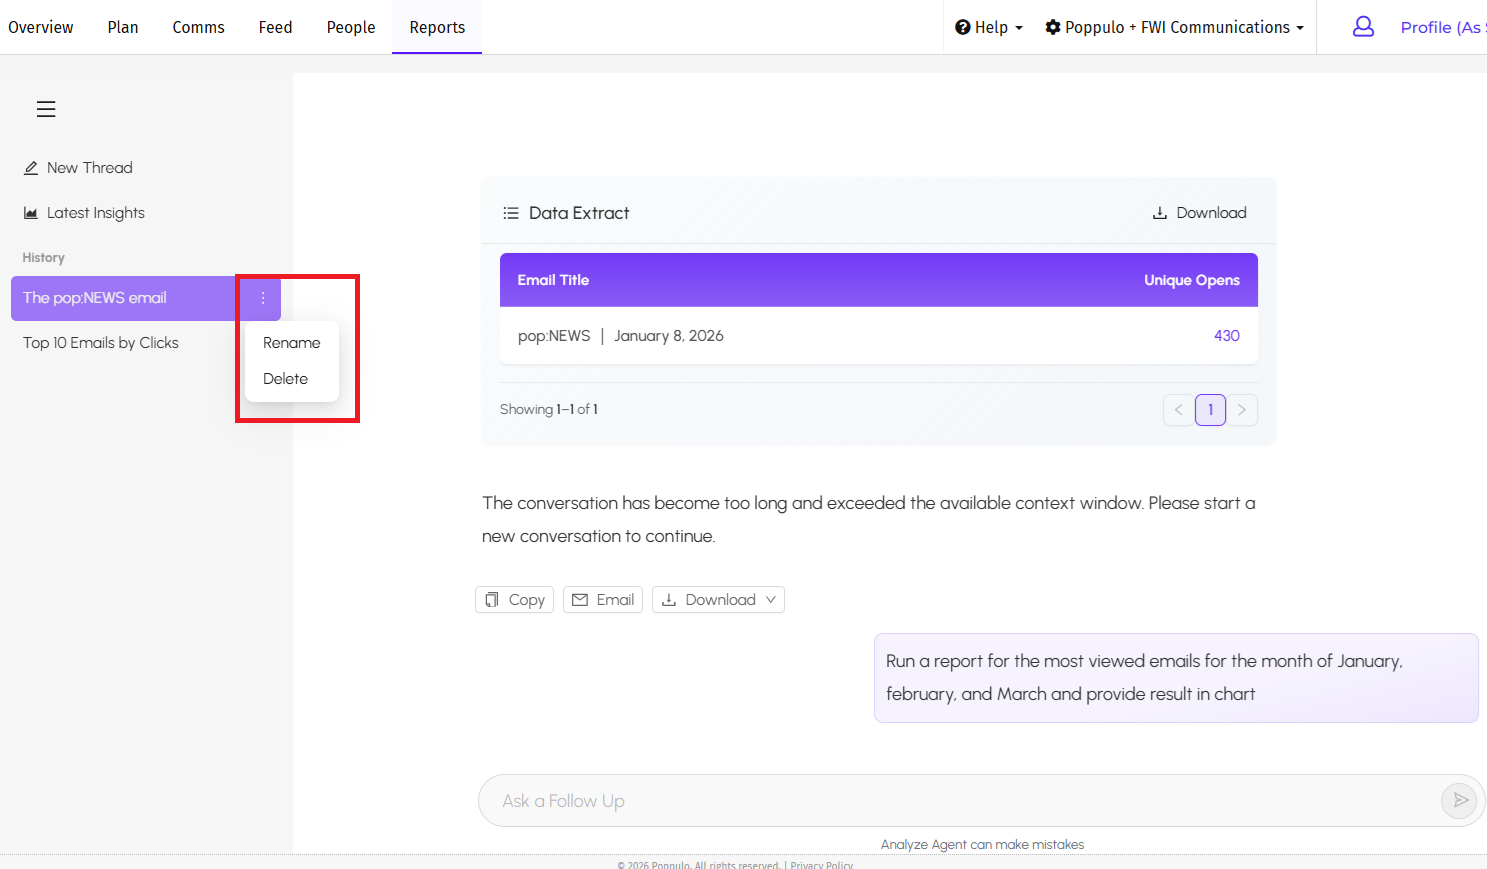
Rename a Thread
If you wish to rename a thread,
- Navigate to the thread that you wish to rename.
- Hover over the three dots and select Rename.
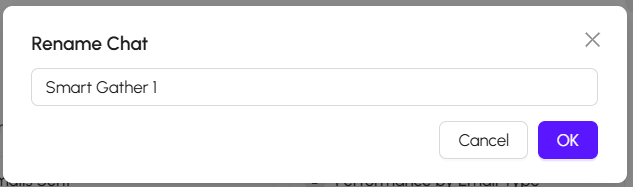
The
Rename Chat pop window appears.
- Enter the name and click OK to rename the thread.
Poppulo AI works best when prompts are clear and specific. Start by describing the outcome you want to understand, then narrow the scope by including details such as timeframe, audience, communication type, or metric.
You can explore communication performance, identify trends, evaluate content effectiveness, and uncover insights across channels, audiences, campaigns and communication types.
Continue refining results with follow-up prompts such as:
- “Break this down by department.”
- “Compare this to the previous quarter.”
- “Summarize the key takeaways.”
- “Visualize this as a chart.”
- “Recommend ways to improve engagement.”
Use the examples below as starting points and adapt them based on your organization, communication channels, and reporting needs.
| Use Case | Example Prompt |
|---|
| Performance metrics | How many total unique opens occurred on my emails in the last 90 days? |
| Benchmarking vs previous months or quarters | Compare my email clicks for content “X” month on month from April-September 2025 |
| Employee segmentation | Look at my employee segment Department and tell me which department had the most clicks for emails in the last 30 days? Which had the least? How can I re-engage them? |
| Metric definitions | How do you calculate a click through rate? |
| Industry benchmarks | What are the Open rate industry benchmarks for the Healthcare industry? |
| Campaign analysis | What are the most frequent themes during the last quarter? |
| Campaign reach | What was the reach rate across our campaigns in the last 30 days? |
| Top-performing campaign content | Show me the top pieces of campaign content that received the most likes last quarter. |
| Content and communication analysis | Can you tell me what we have communicated about environmental initiatives in our articles from February? |
| Content length analysis | How do shorter articles compare to longer articles in terms of views and engagement? |
| Search by phrase | Show me every email since Jan 1 that mentions phishing or security training |
| Search by phrase | Show me messages in the last 90 days about completing security training to access ChatGPT |
| Search by phrase | Show me emails in the last 30 days that mention the word Diversity |
| Search by phrase | Have we communicated about our upcoming acquisition in the last 6 months? Show me messages that mention it |
| Search by phrase | Pull messages from the last 30 days that include benefits enrollment |
| Performance analysis | Show me the performance of all messages sent year to date relating to engagement |
| Campaign performance | Show me the performance of our campaigns in the last 180 days. |
| Campaign rankings | Provide the top 5 campaign content pieces this year, ranked by unique views. |
| Campaign analysis | What is the count of unique campaigns in the last year? |
| Campaign reach | What was the reach of our campaign content in the last 90 days? |
Note: Campaign-based prompts require an adequate quantity of existing campaign data to return meaningful results.
