The
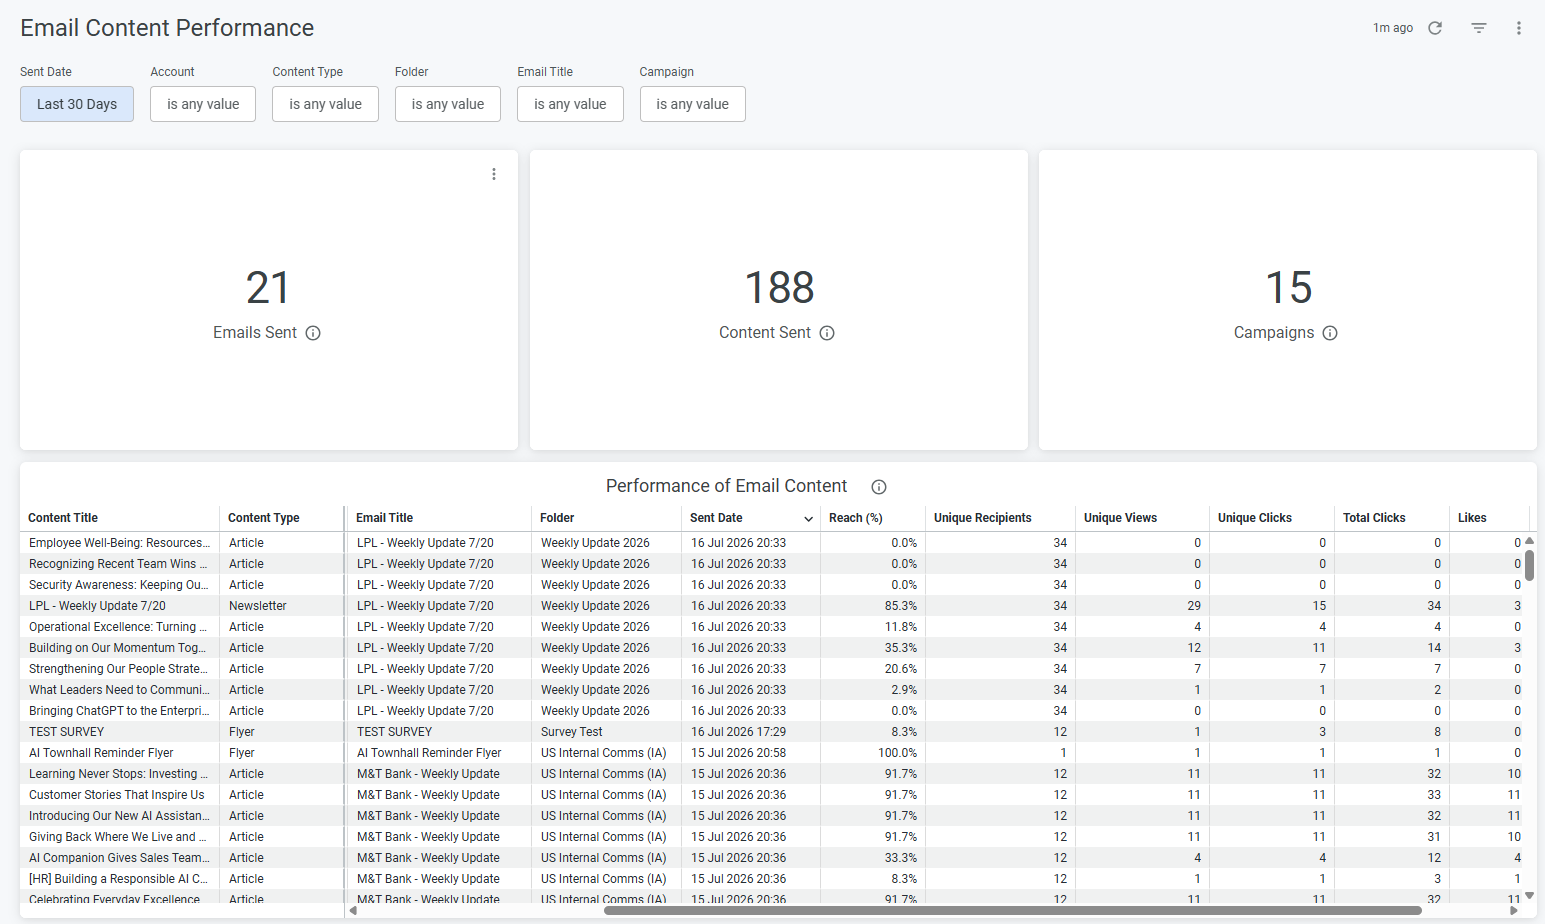
Email Content Performance dashboard provides insight into how individual pieces of content perform across your email communications. Use this report to identify which content drives engagement, compare performance across campaigns, and understand how different types of content resonate with your audience.
This article explains how to access the report, apply filters, and interpret the metrics displayed in the dashboard.
Note: It can take up to 24 hours after an email is sent for data to become available in Advanced Analytics.
 Note
Note: Hover over the information icon on any report tile for additional details about the metric.
To View the Content Performance Dashboard
The report can be viewed at both the Enterprise and Sub-Account level. At the Sub-Account level, the report displays data for the current Account only. At the Enterprise level, the report displays aggregated data across the selected Accounts.
- In the Reports Area of your Account, select Content Performance from the Email reports menu on the left.
To Filter your Reports
Use the filters at the top of the dashboard to focus on the data most relevant to your analysis.
Available filters include:
Sent Date
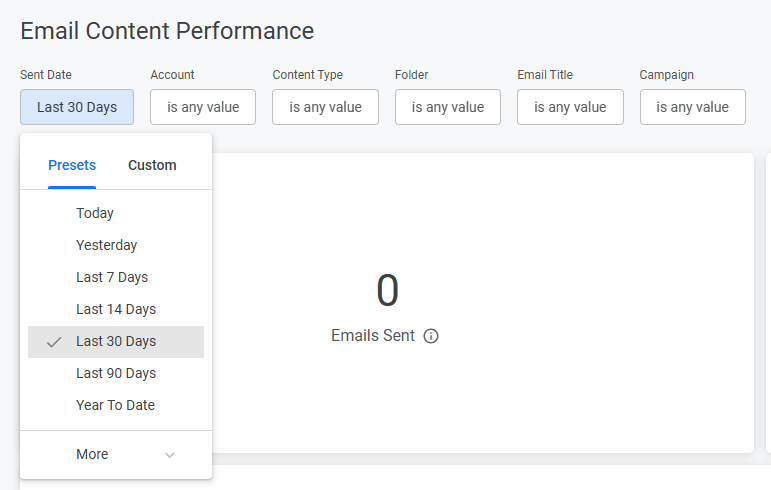
These reports can be filtered by Sent Date; Standard Date Range filter based on Email send date. You can select from preset or custom date ranges.
Account
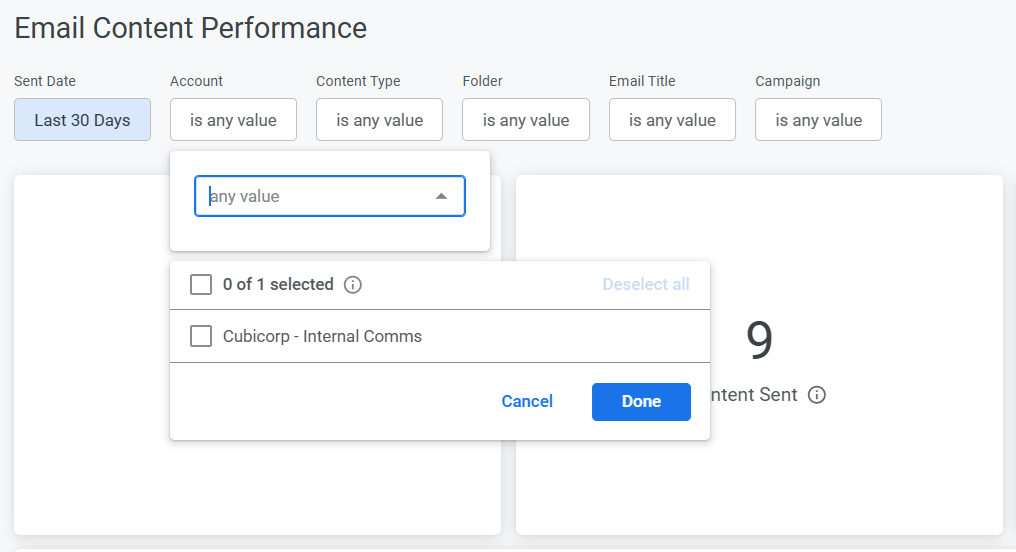
The results can also be filtered by Account Name; From Enterprise level you can select one or multiple Sub-Accounts. At Sub-Account level you can only view data for the Account you are within. Select the drop-down arrow to choose the Sub-Accounts of interest.
Content Type
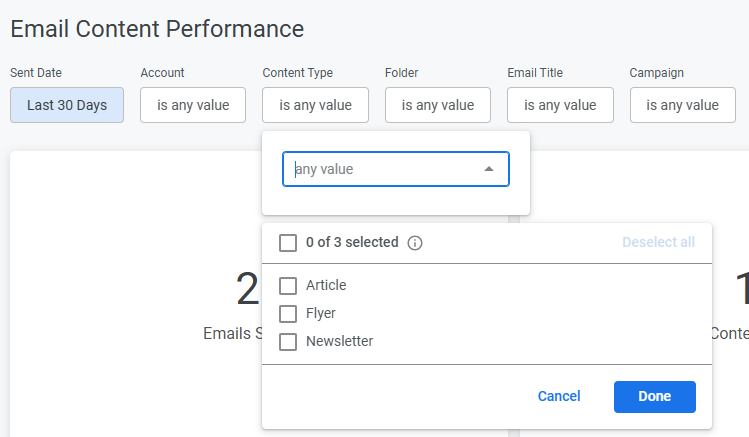
Filter the report by content type: Newsletter, Flyer or Article.
Folder
Select one or multiple Email Folders to view the related data. Select the drop-down arrow to choose your folder.
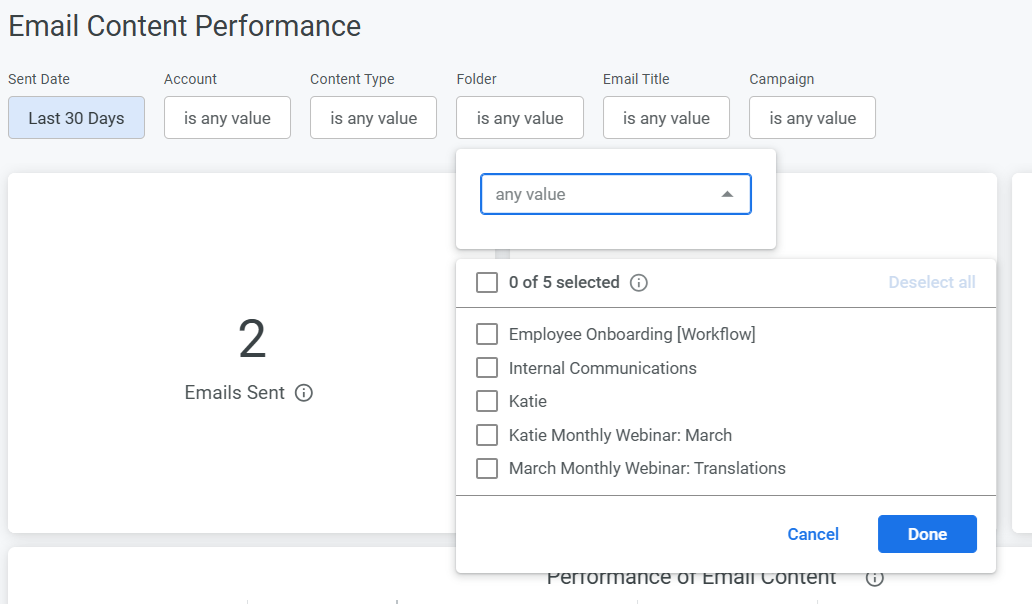
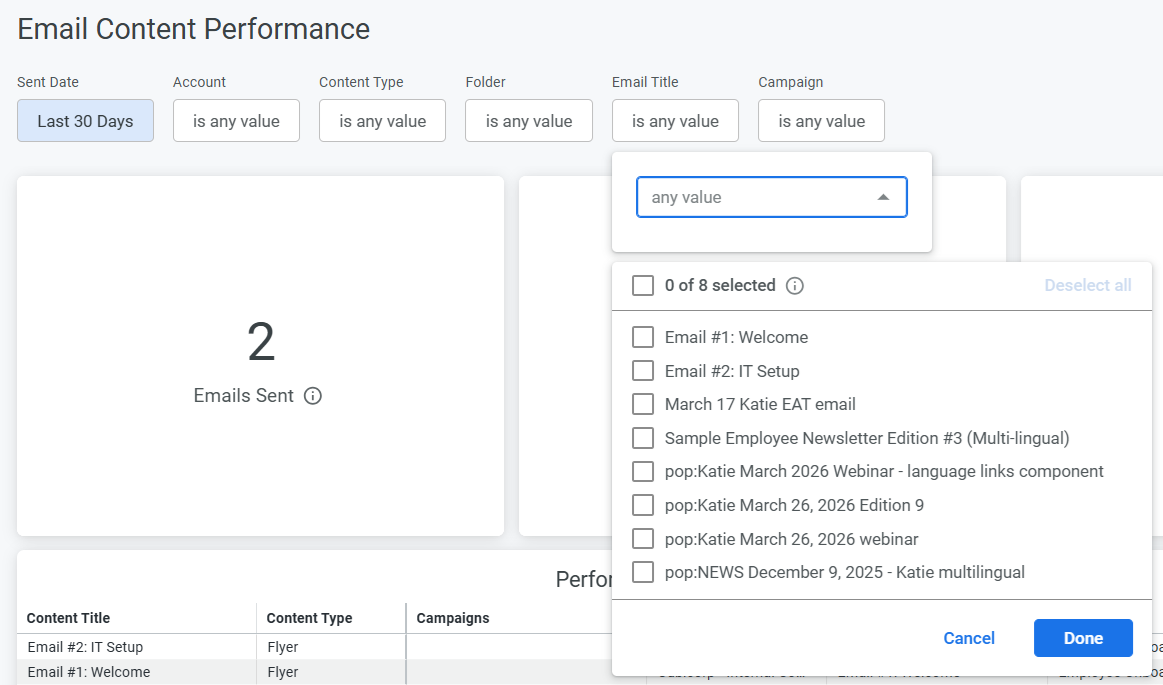
Email Title
Select the name of one or multiple individual Emails to view related data.
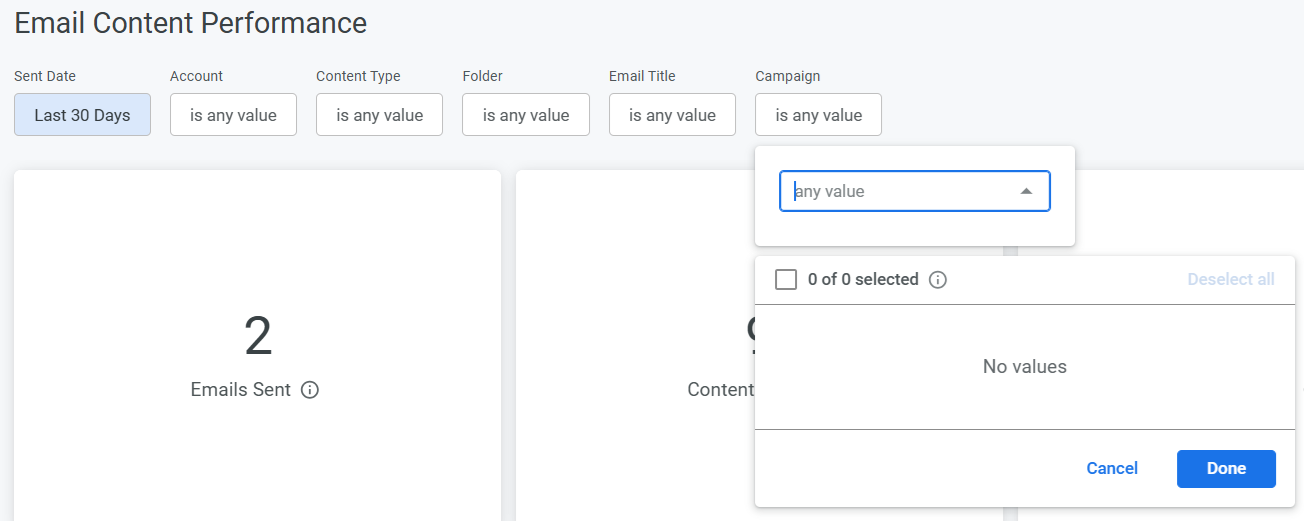
Campaign
View results by Campaign. Select the drop-down arrow to choose your Campaign.
Whenever you make changes to your filter, remember to select the Update button, at the top right of the screen, to view the updated results.
The Email Content Performance Overview
The dashboard provides three summary metrics that give an overview of the selected data. Note: You can also
Download Reports, from any of your report tiles, by hovering over the tile, selecting the
Tile Actions (the 3-dot icon), and choosing
Download data.
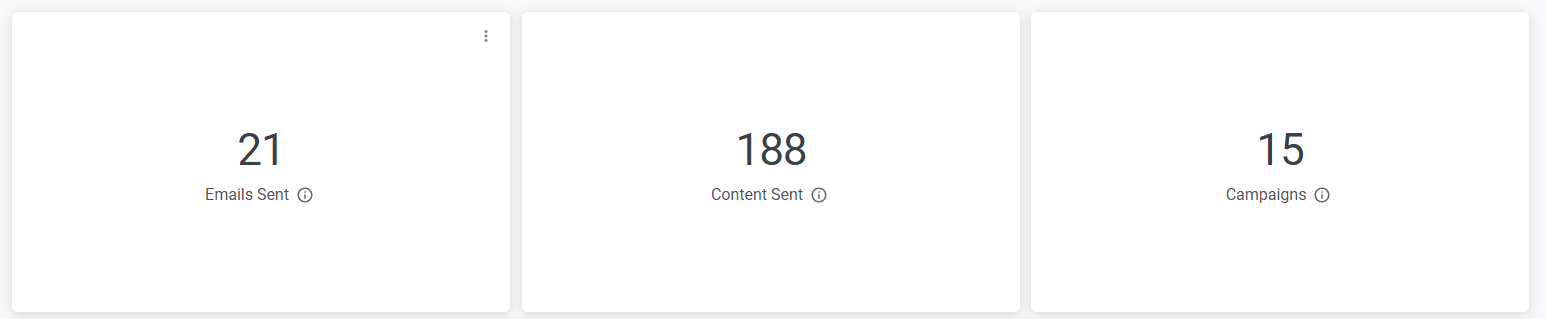
Emails Sent
Displays the total number of emails included in the report based on the selected filters.
Content Sent
Displays the total number of content items included in the selected emails.
Campaign Count
Displays the number of campaigns represented in the selected results.
Performance of Email Content
The
Performance of Email Content table provides detailed performance metrics for every content item included in the selected emails.
This table is the primary area for analyzing content engagement and identifying which content performs best across your organization.

The table displays the following information for each content item:
- Content Title (Article or Email Title)
- Content Type (Article, Newsletter, or Flyer)
- Email Title
- Campaign
- Account
- Folder
- Sent Date
- Reach %
- Unique Recipients
- Unique Views
- Unique Clicks
- Total Clicks
- Likes
- Comments
Select any column heading to sort the table and quickly identify the highest or lowest performing content for a particular metric.
Note: The interaction metrics displayed depend on the type of content. For example;
Views,
Clicks,
Likes, and
Comments are only available for article content. A view is counted if a user clicks, likes, or comments on the article.
Unique Recipients is based on the number of recipients who received the email. Interaction metrics represent engagement with the specific content item, while email-level metrics include interactions with both the email itself and all content contained within it.
Use this table to:
- Identify the content that generates the highest engagement.
- Compare the performance of content across different campaigns or email sends.
- Understand which emails and campaigns consistently deliver the strongest content engagement.
- Identify high-performing content that can be reused or replicated in future communications.
To export the data for further analysis, hover over the table, select the
More menu (three dots), and choose
Download data.
